ESG Country Risk Research & Intelligence
Quantitative analysis of ESG country risk, sustainable competitiveness, and national benchmarking across 193 countries — for investors, policymakers, and corporate decision-makers.
Showing 26 articles
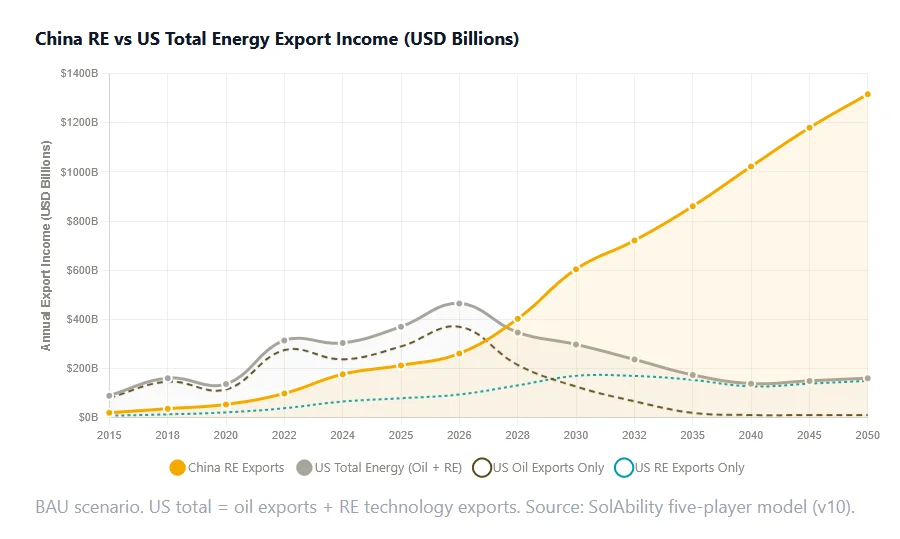
Drill Baby Drill vs Electrification: The US-China Energy Competitiveness Gap
GSCI data reveals a widening competitiveness gap between the US and China in renewable energy manufacturing. China overtook the US in high-tech manufacturing in 2015 and overall competitiveness in 2022, and now leads by widening margins across every industrial indicator.
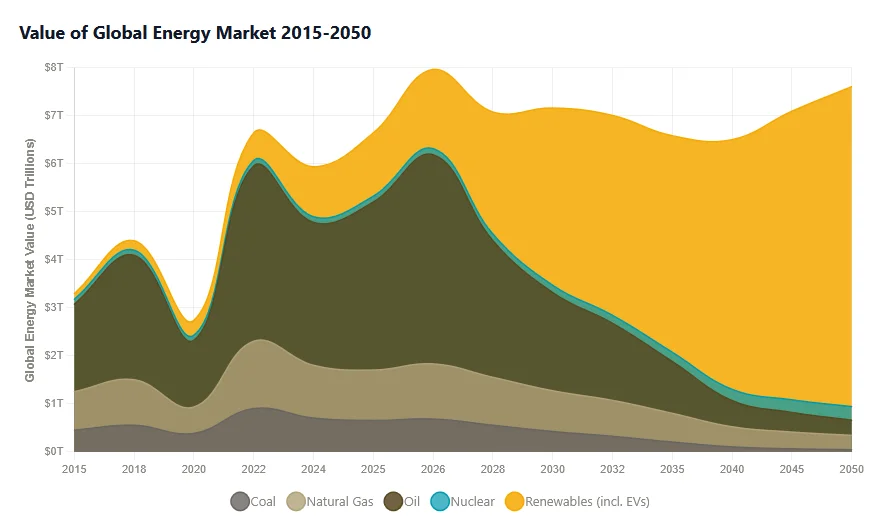
The Global Energy Market Outlook: From Fossil Fuels to a $6-8 Trillion Renewable Economy
The $6-8 trillion global energy market is undergoing structural transformation. Renewable energy costs have collapsed; fossil fuels are becoming uncompetitive. This is the story of winners, losers, and the economic shift defining the next half-century.
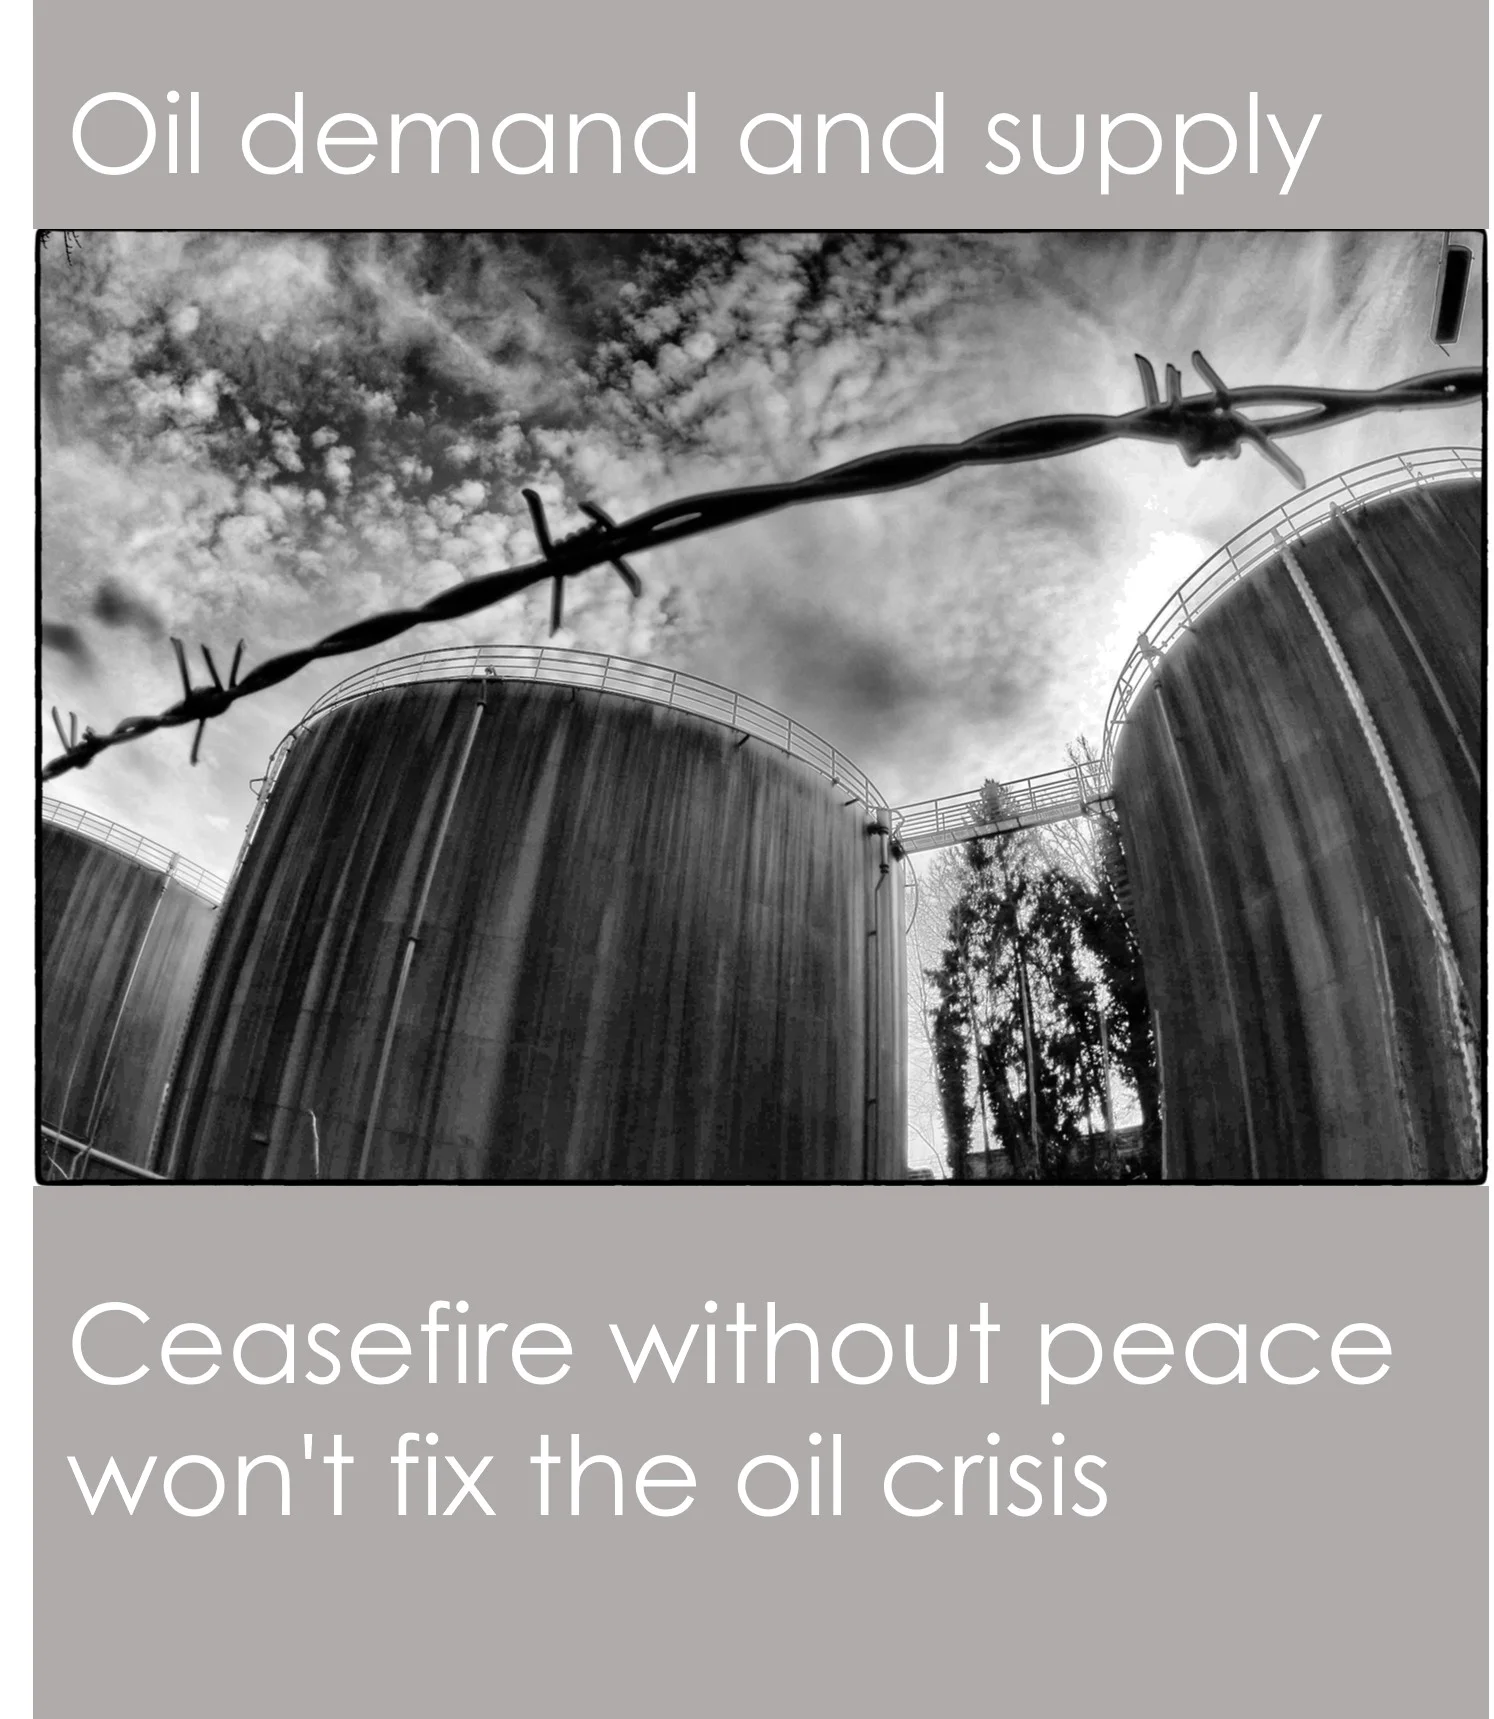
Why a ceasefire won't fix the oil crisis: supply, demand, and the phantom ceasefire problem
Global oil inventories were at a five-year high when the war started. Seven weeks later, they're draining at 200 million barrels per month. Analysis of supply recovery lags, the phantom ceasefire scenario, refined product shortfalls, and what consumers actually pay.
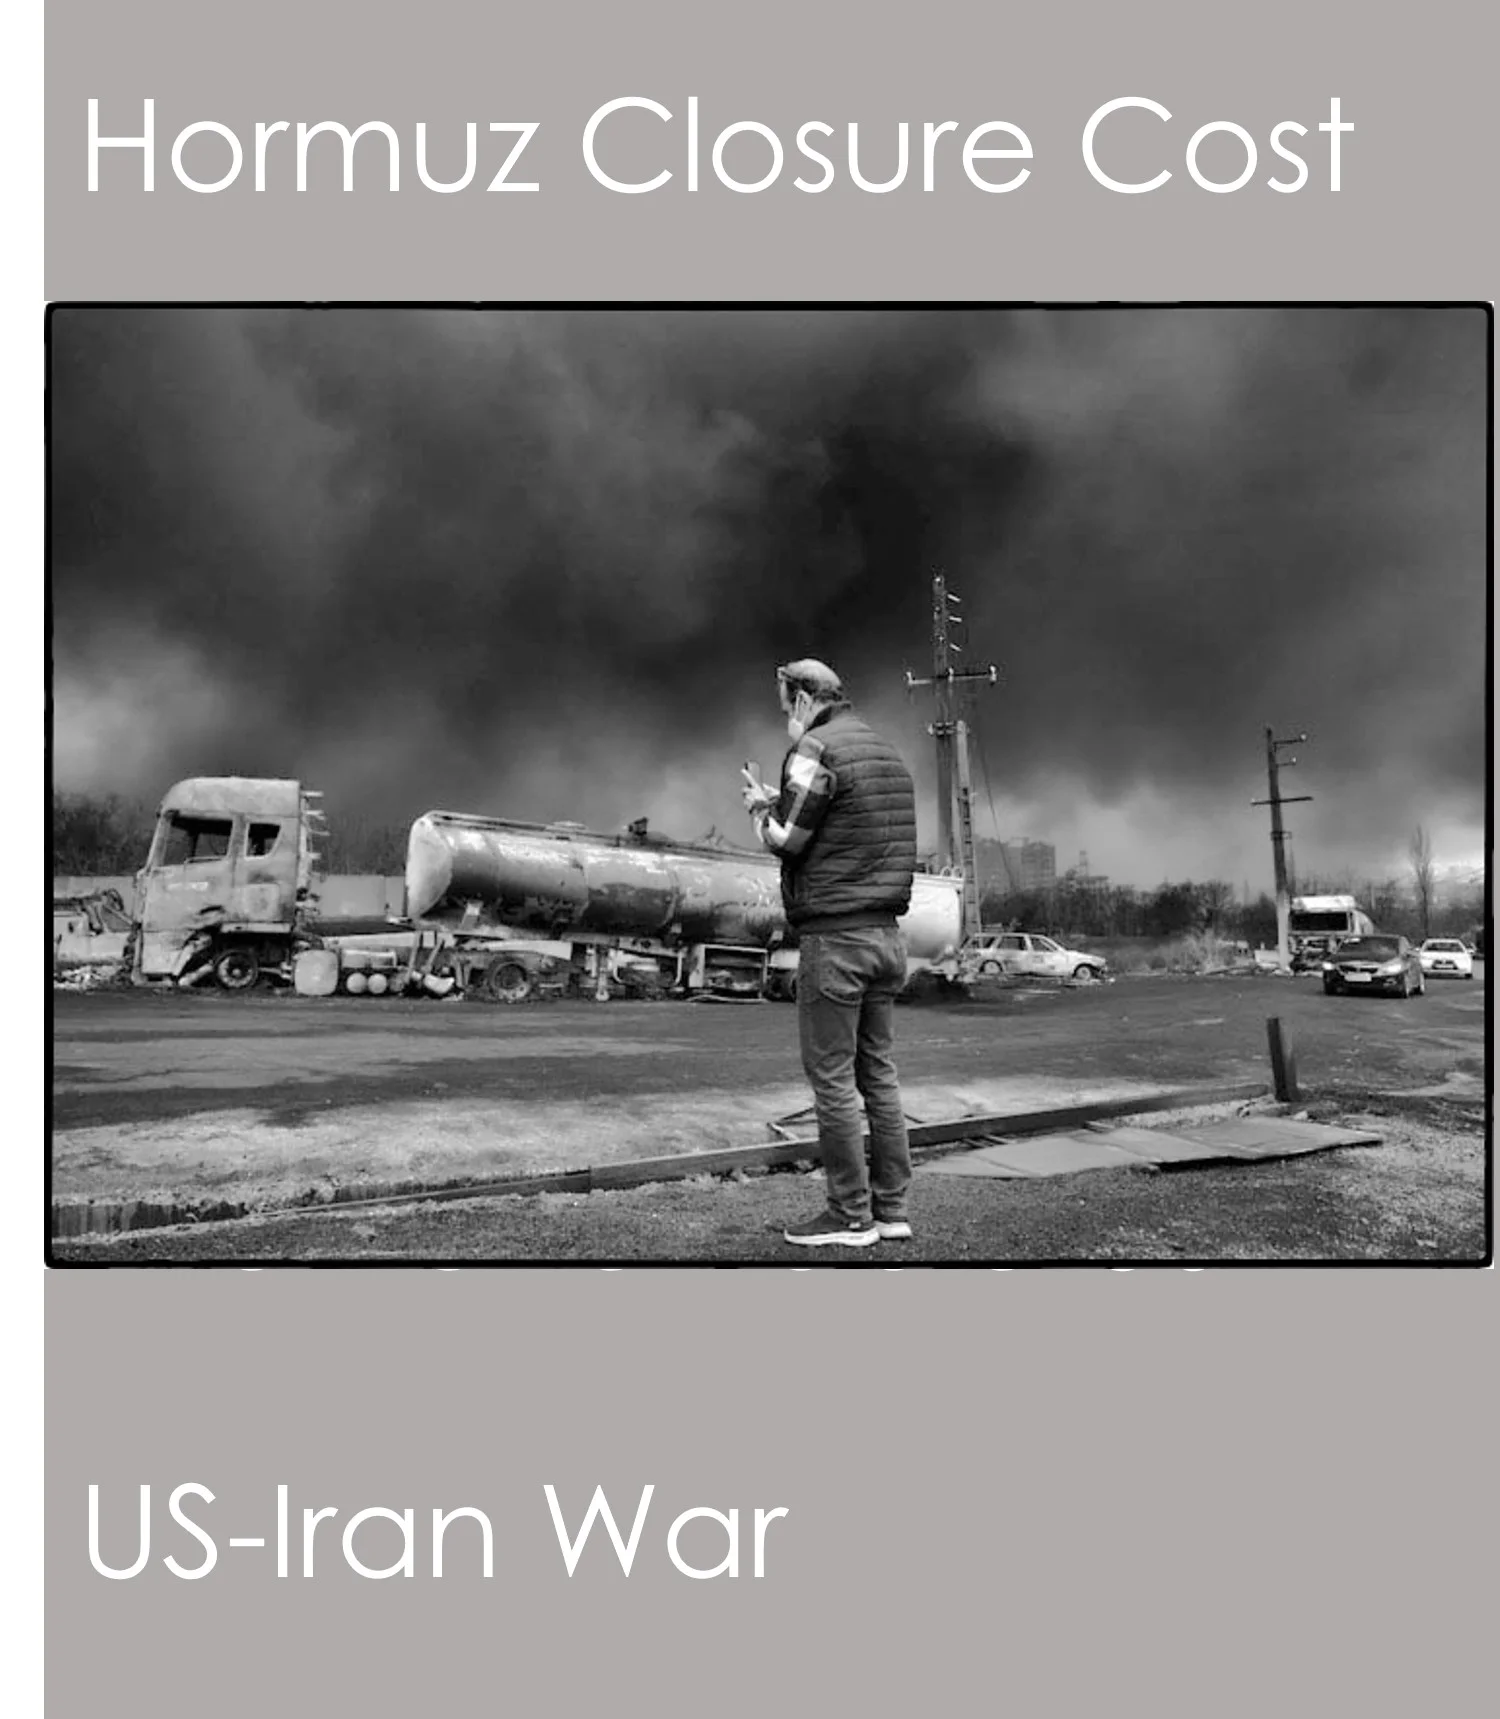
Gulf Crisis 2026: The Daily Cost of the Closure of the Strait of Hormuz
Interactive day-by-day cost model of the Strait of Hormuz closure. Three scenarios, four economic channels, 87 countries. Daily cost from $0.6B to $36B/day. Cumulative GDP loss up to $3.5T in a prolonged conflict.
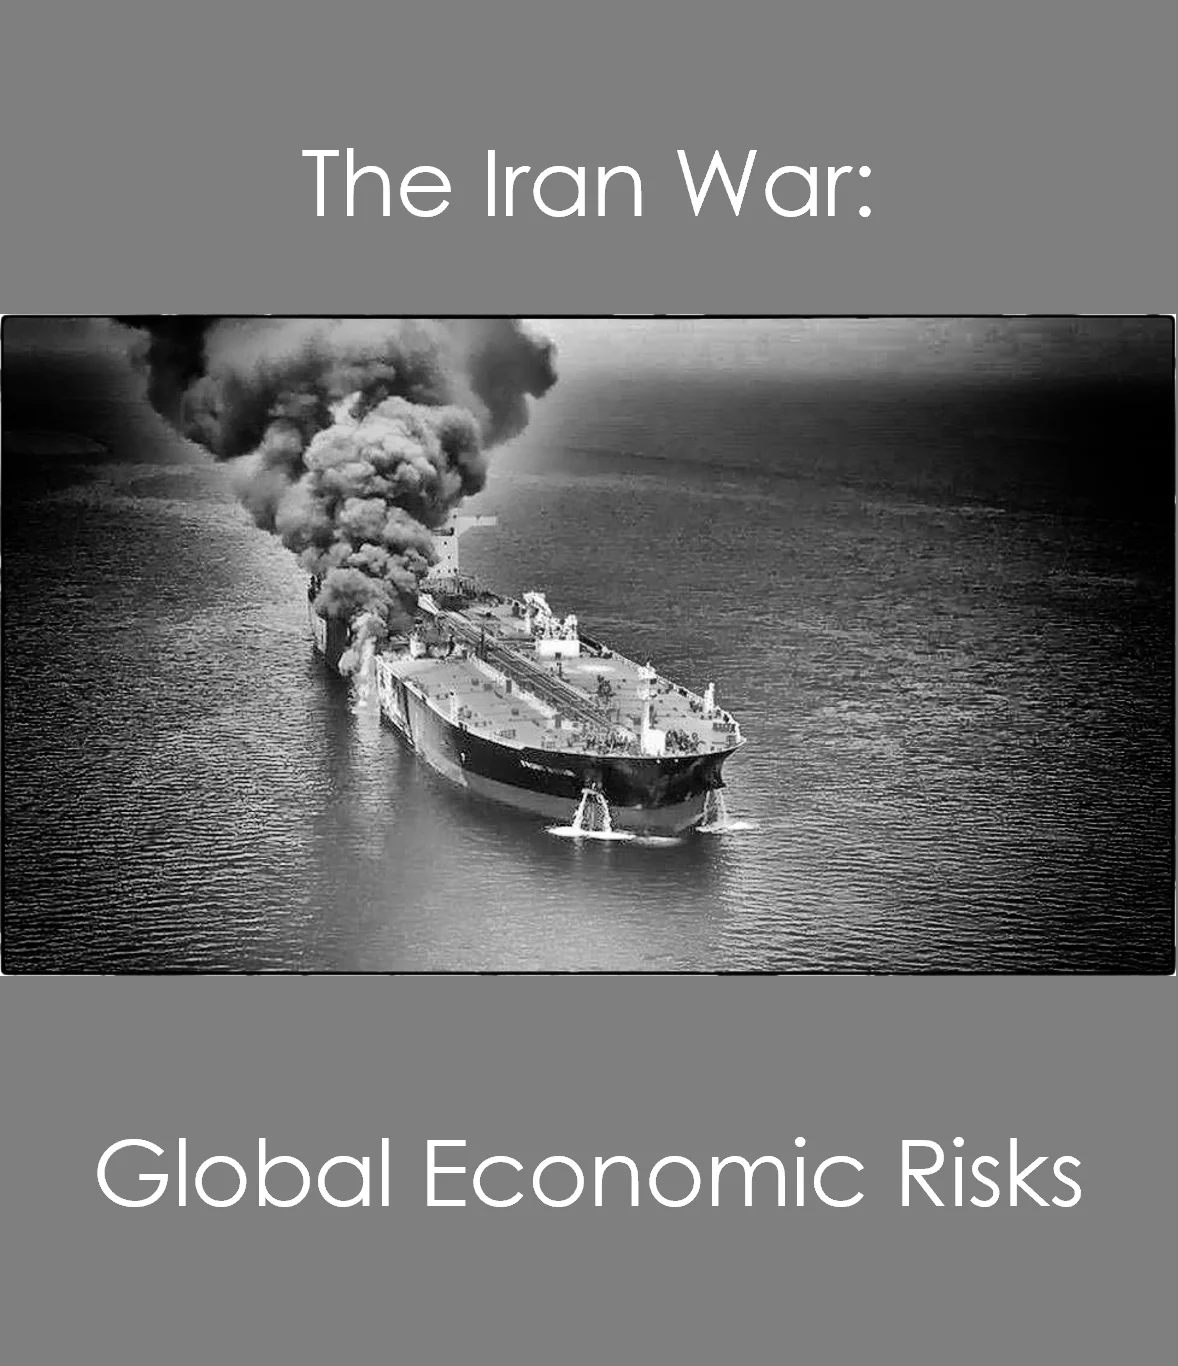
The Iran War: Implications for the Global Economy
The effective closure of the Strait of Hormuz has stranded 72% of Gulf energy exports. Three scenarios model global GDP impact from −$330B to −$2.2T — and why Gulf states are net losers in all of them.
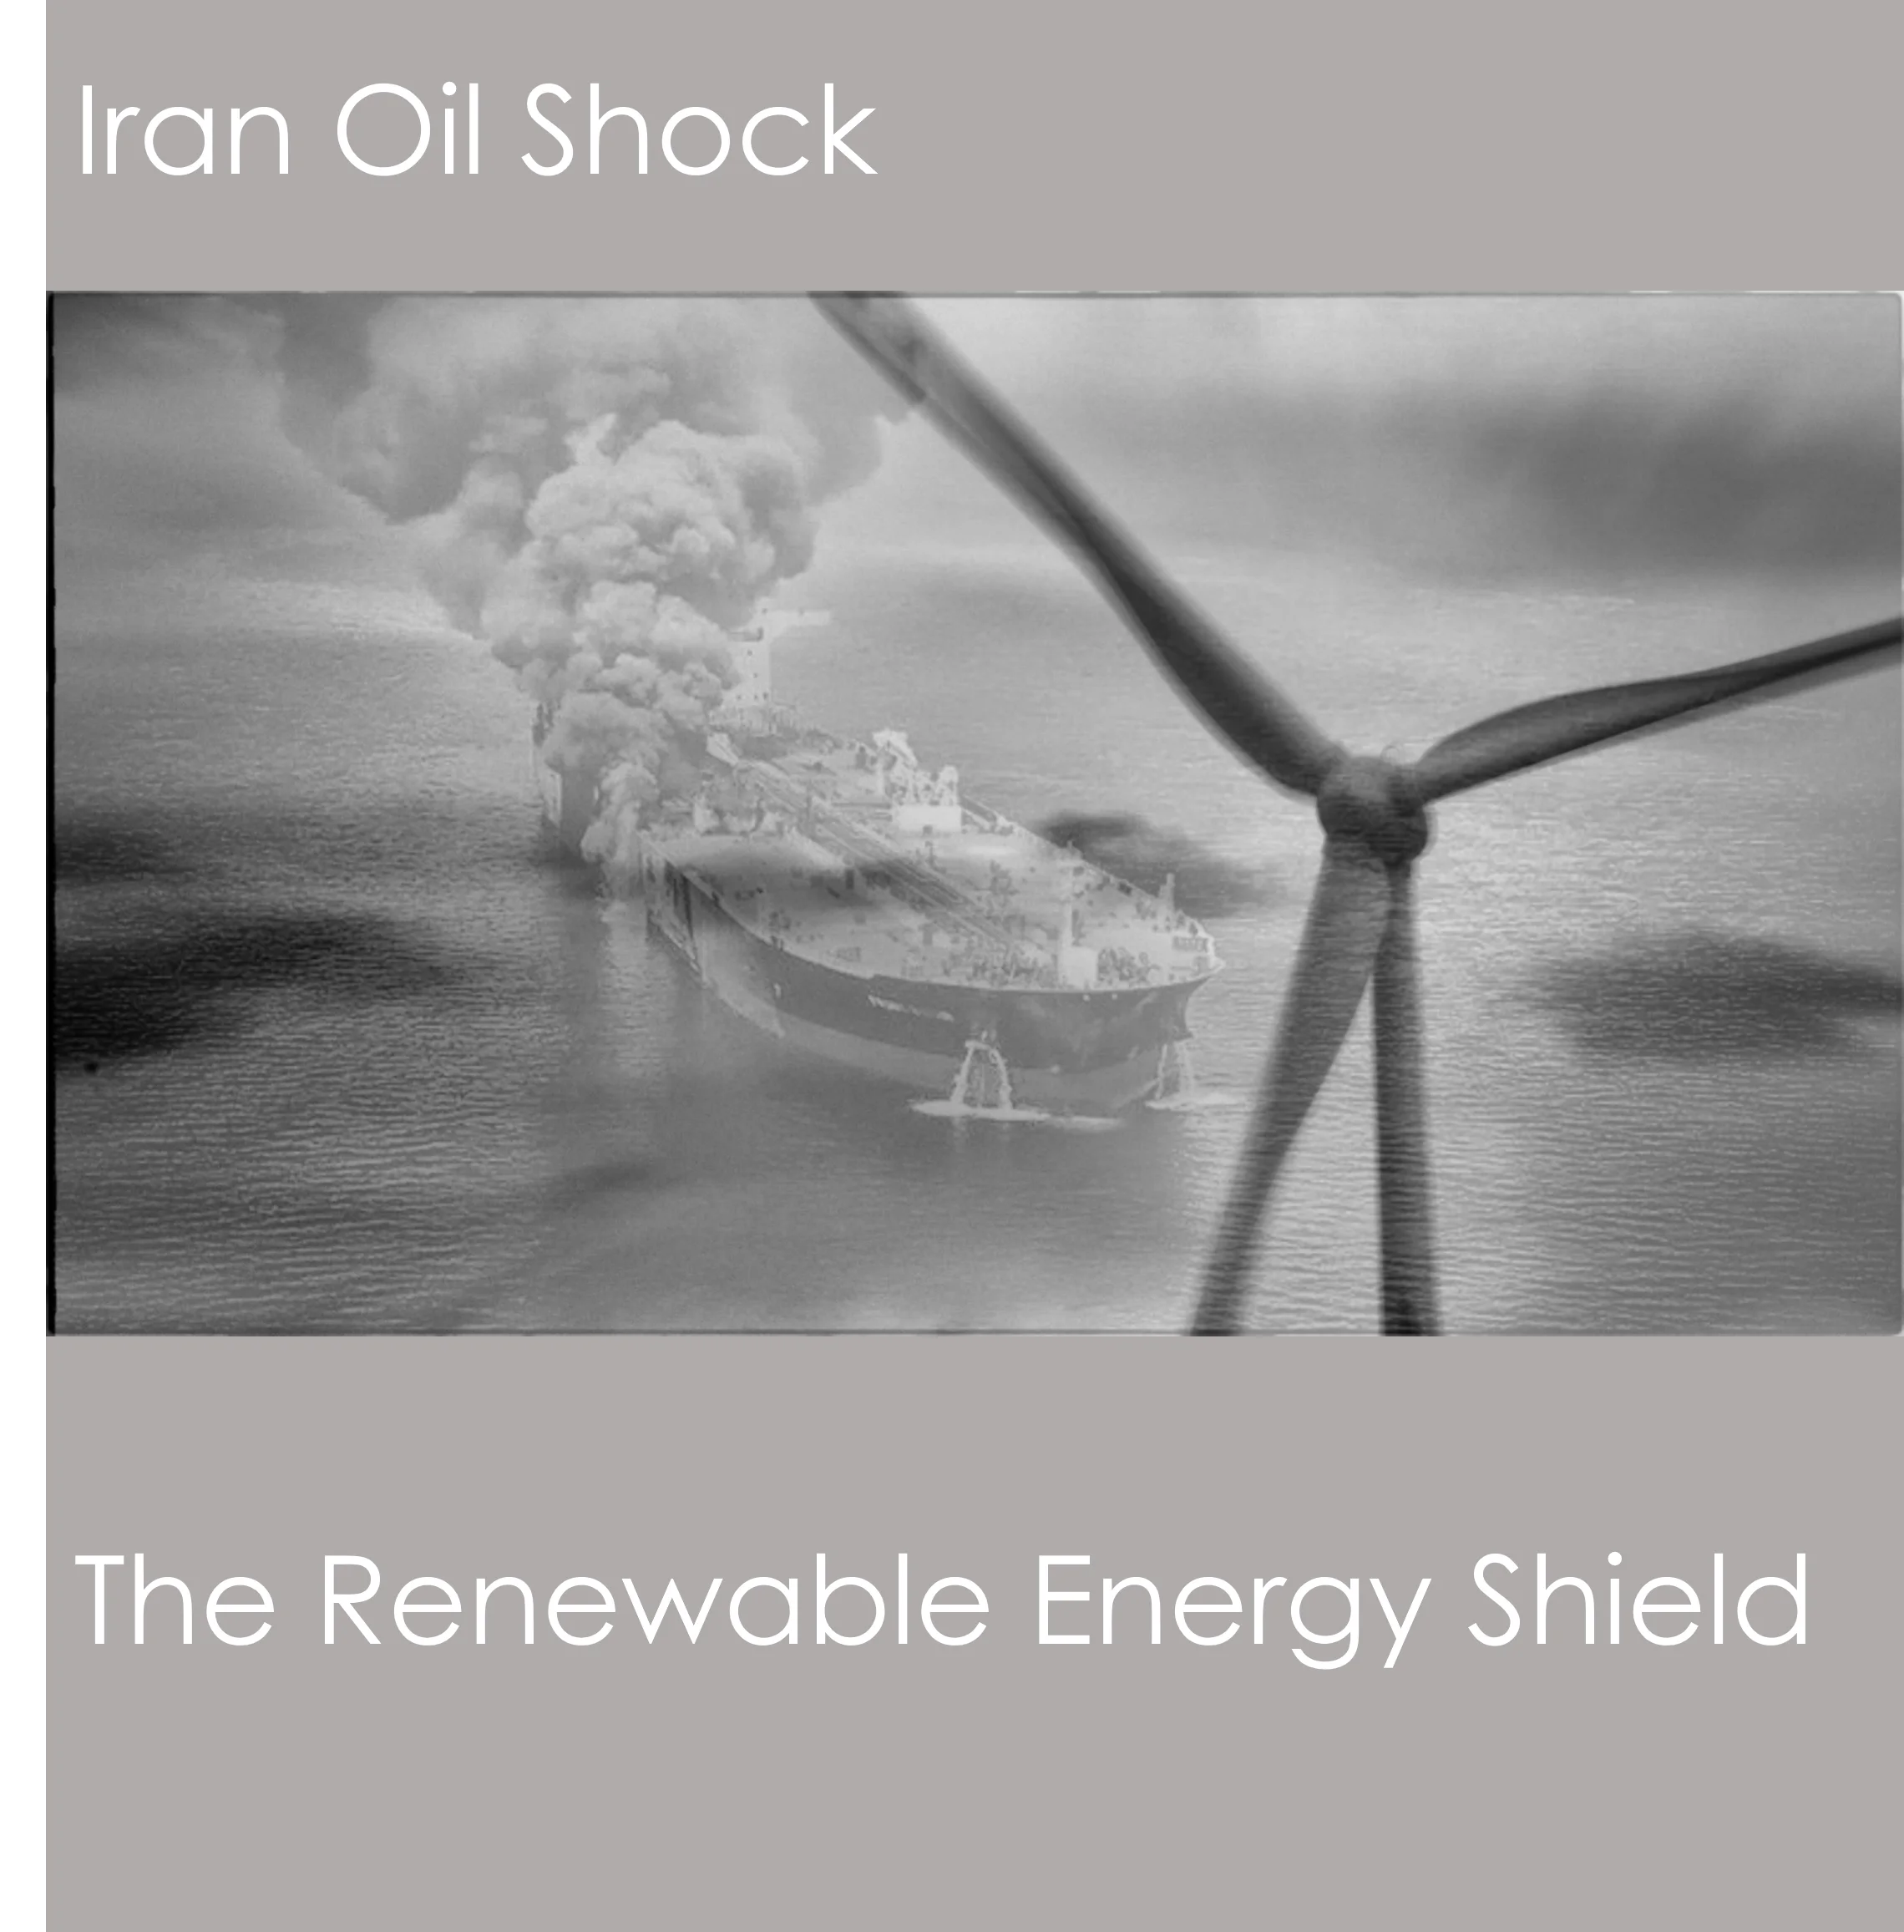
Iran Oil Price Shock: The Renewable Energy Shield
How a country's energy mix determines its vulnerability to the Gulf crisis. Renewable electricity buffers 6-29% of total energy exposure across 34 countries. Uruguay's 98% RE grid saves 1.45pp of GDP growth; China's LNG trap makes it more exposed than 20 years ago.
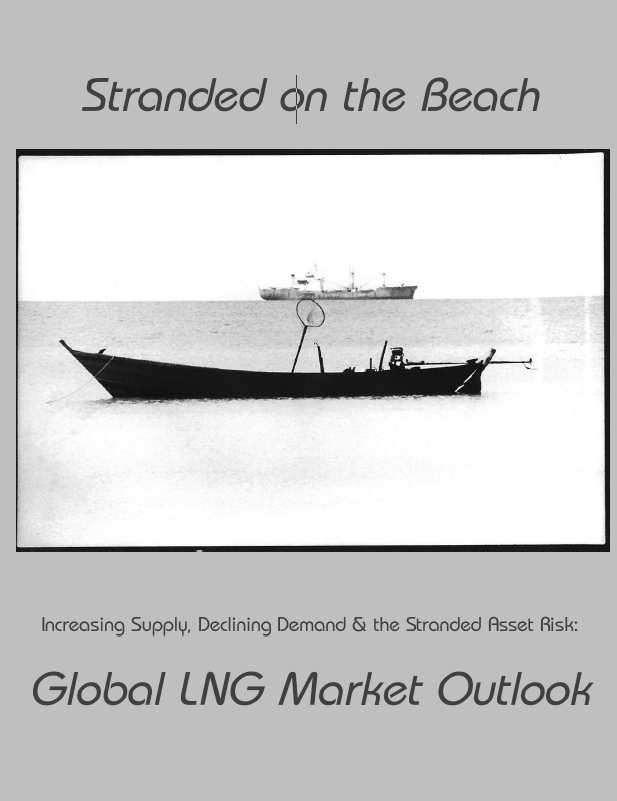
Global LNG Outlook: Stranded Assets
Approximately $394 billion in committed LNG capital faces stranded asset risk as renewable energy at $30-40/MWh defeats LNG-fired power at $80-120/MWh. Analysis of five demand scenarios through 2035 reveals a structural surplus of 278 MTPA by 2030.
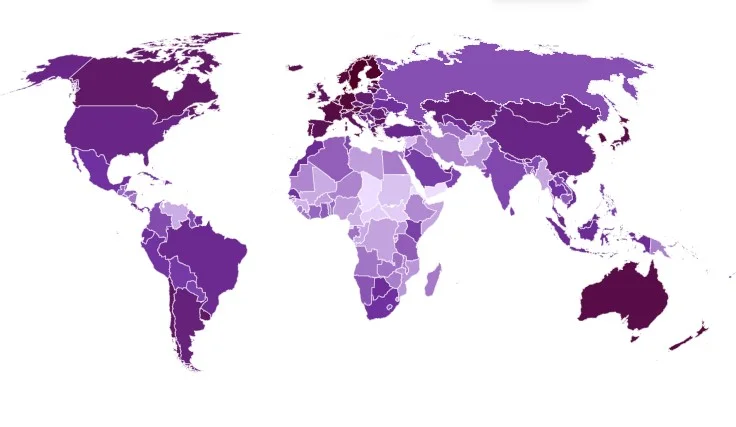
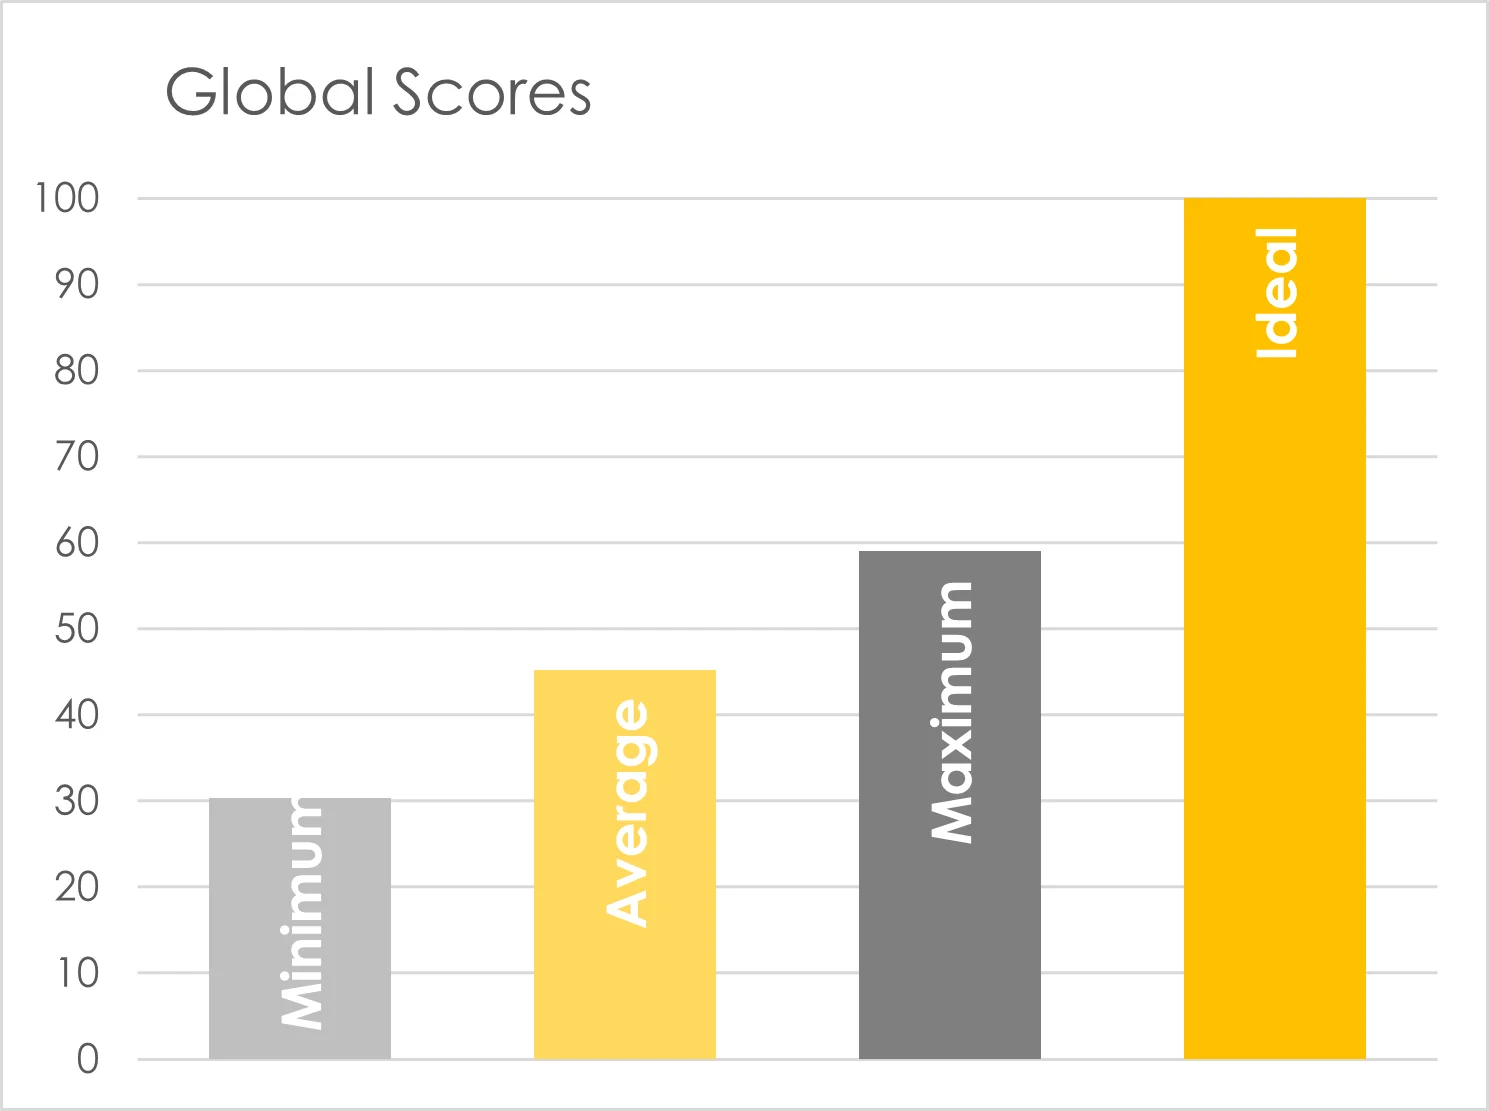
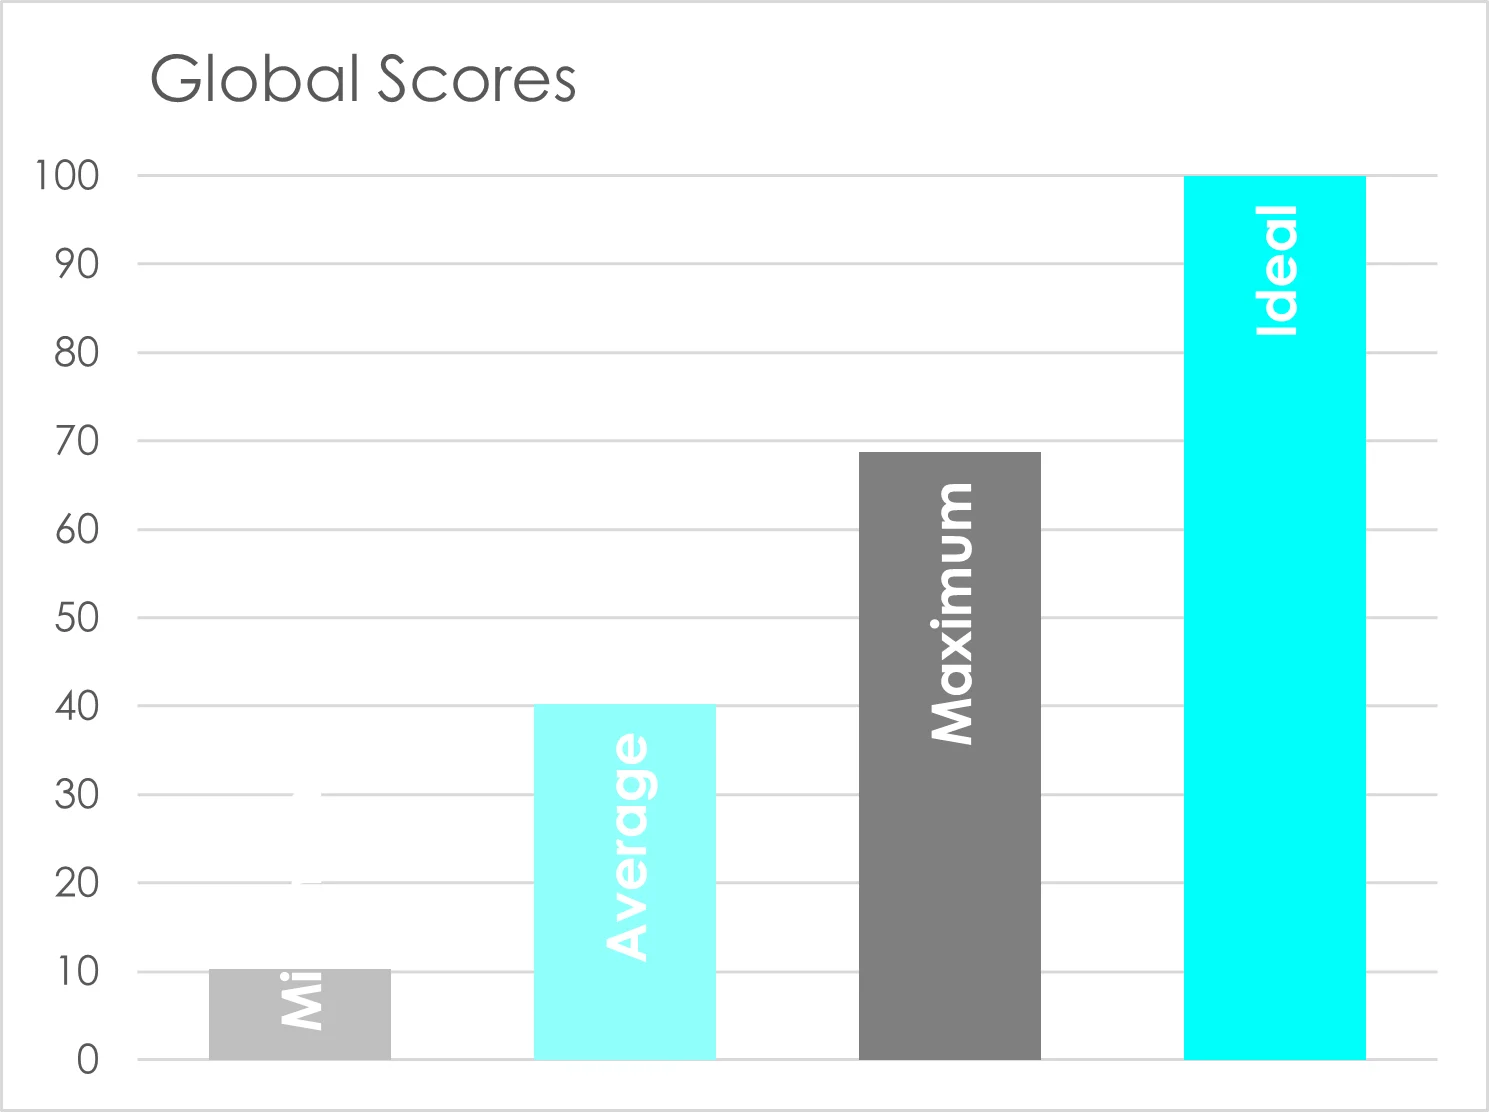
2025 Global Sustainable Competitiveness Index
Comprehensive framework for evaluating country-level performance across 192 nations based on over 280 quantitative indicators. Finland tops the rankings while China continues to outperform the US.
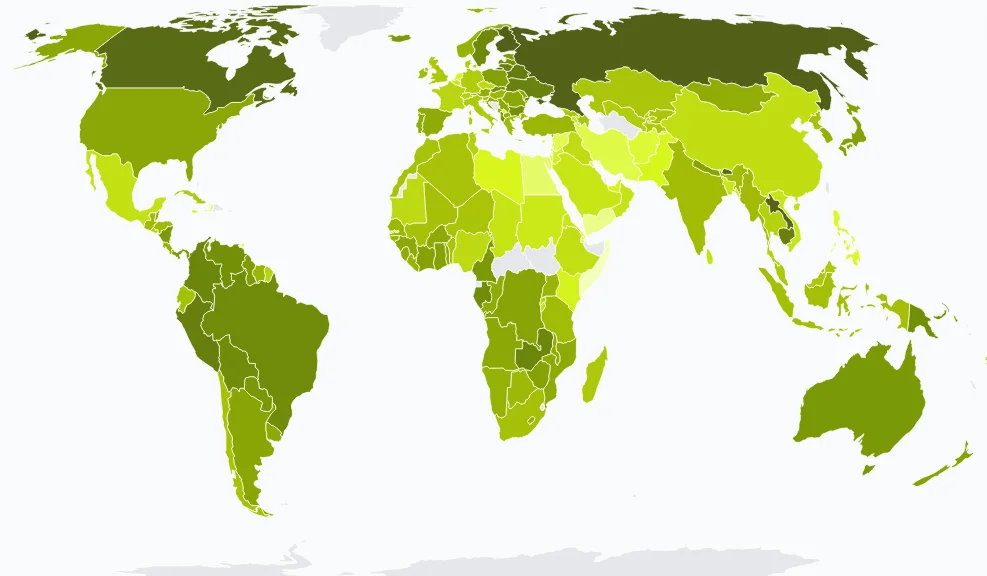
The Global Natural Capital Index 2025
Natural capital rankings analyzing 193 countries based on water availability, biodiversity, and ecosystem health. Tropical nations and low-density countries with rich biodiversity score highest in environmental performance.
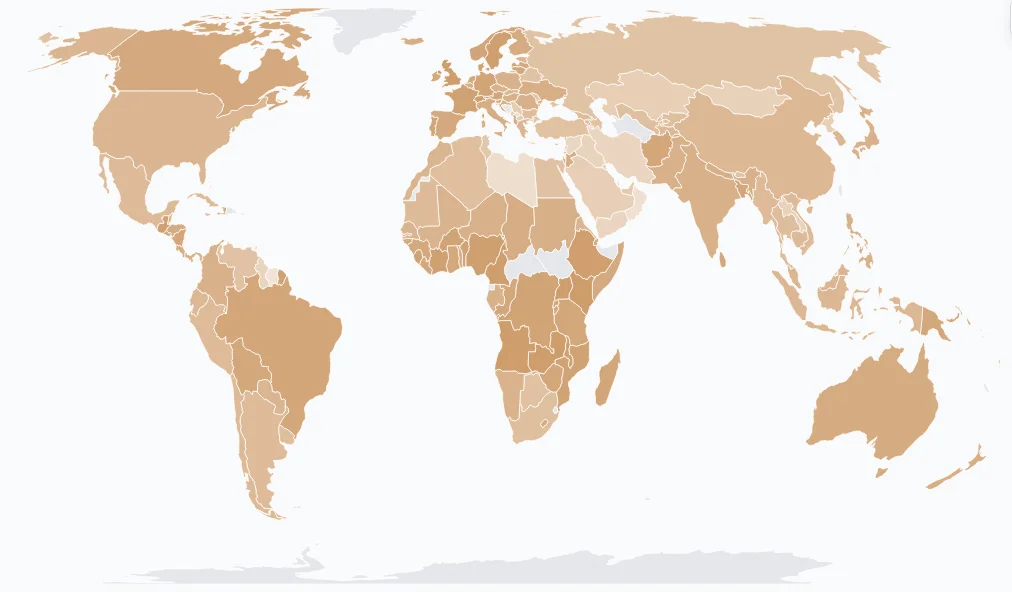
The Global Resource Usage Index 2025
Resource efficiency rankings analyzing 193 countries reveal less industrialized nations consume fewer resources per capita than manufacturing-intensive economies. Comprehensive analysis of resource intensity vs efficiency and circular economy pathways worldwide.
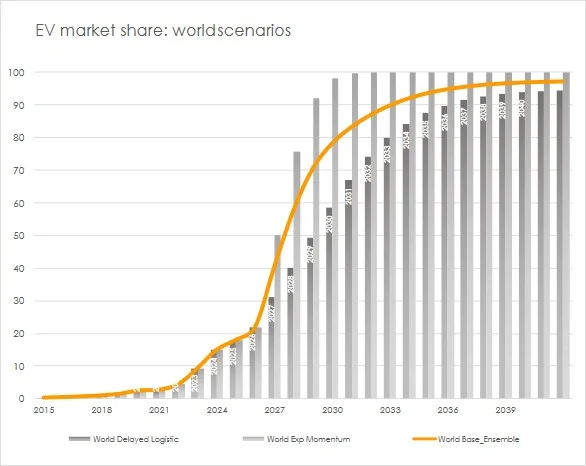
The global car industry by 2030: EV's at 85%
This article examines the automotive industry at a critical juncture, forecasting outcomes for the EV transition through 2030. The analysis identifies emerging winners and losers in this transformation, with particular attention to China's advantageous market positioning.
The Global Sustainable Competitiveness Index 2024
A comprehensive framework for evaluating country-level ESG performance employed by governments to track progress toward sustainability objectives, offering detailed analysis across multiple dimensions of environmental, social, and economic metrics.
The Gulf Countries: Ready for the Energy Transition?
Gulf countries face a critical business challenge as they remain heavily dependent on oil & gas exports while confronting declining global energy demand and the rising cost-competitiveness of renewable energy sources.
Phasing Out Fossil Fuels in 10 Years
World could save U$ 4 trillion per year by going all renewable and electric. The energy transition is inevitable as renewable electricity from wind and solar becomes the cheapest form of energy humanity ever had.
The Global Governance Index 2024
This article examines governance performance across nations through SolAbility's comprehensive Global Governance Index. The index measures how effectively governments function based on empirical data rather than subjective assessments.
The Social Capital Index 2024
The most thorough assessment of social capital available worldwide, examining how social capital is measured globally across all countries using comprehensive metrics, providing insights into community bonds and trust levels.
The Global Intellectual Capital Index 2024
This article examines how education quality and research & development performance serve as key measures for comparing intellectual capital across nations worldwide.
The Global Natural Capital Index 2024
This piece examines natural capital's critical role in supporting a nation's ability to sustain its population and economy, providing insights into how countries are managing their environmental resources and their relationship to economic competitiveness.
Fossil fuels are no longer competitive
Technological advancements and mass installation of renewable energy and electrification accelerate the end of oil. This piece discusses how the energy sector is undergoing fundamental shifts that are making traditional fossil fuel sources increasingly unviable.
The Global Sustainable Competitiveness Index 2023
An alternative framework to traditional GDP metrics for evaluating national performance, offering comprehensive measurement across multiple dimensions of country development beyond conventional economic indicators.
The Global Sustainable Competitiveness Index 2017
Northern Europe leads the GSCI in sustainable competitiveness rankings. The analysis indicates that U.S. competitive standing faces headwinds from proposed policy changes, while challenging conventional wisdom about credit ratings.
China-US Comparison
This piece examines the competitive positioning of the USA and China as the world's largest economies, exploring how the US administration's policy priorities and China's governance changes may reshape their competitiveness outlooks.

ESG Credit Rating vs Country Credit Rating
This article examines how Environmental, Social, and Governance (ESG) credit ratings compare to traditional country credit ratings, exploring the relationship between a nation's sustainable competitiveness metrics and its financial creditworthiness.
Sustainable Competitiveness in Korea
Korea ranks 41st in the Global Sustainable Competitiveness Index 2016. The analysis reveals a very mixed picture in the nation's sustainable performance across different measurement categories.
US Competitiveness
This analysis examines why the United States ranks only 32nd in the Global Sustainable Competitiveness Index, exploring the nation's sustainable competitiveness performance across various metrics used to assess economic and environmental resilience.
What Gets Measured Gets Done
A do-it-yourself manual for designing and implementing comprehensive sustainability initiatives within organizations. Created by the makers of three DJSI Industry Group Leaders, this report offers guidance on integrating dynamic corporate sustainability practices.
Browse Our Complete Publications Library
Access our full collection of research reports, country analyses, and ESG studies.
View All PublicationsWant to explore our full index?
Discover comprehensive rankings and analysis for 193 countries.
Explore the GSCI