The global LNG landscape is characterised by two opposite developments: approximately $394 billion in committed capital under construction meets cancellations of LNG terminals and declining demand as renewables prove economically superior.
- Approximately $394 billion in committed LNG capital is currently under construction or in advanced development globally across 25 major projects, representing roughly 390 MTPA of new and expanded liquefaction capacity.
- At the same time, planned LNG receiver terminal and re-gas stations are being cancelled (Pakistan, Vietnam, the Philippines)
- On cost-based comparison, LNG-fired electricity generation at $80-120/MWh is not even remotely competitive against solar/battery generation at $30-40/MWh – the leapfrogging (bypassing fossil energy infrastructure development in favour of cheaper renewable electricity) in lesser developed economies has already taken off and is only going to accelerate
In short: increasing supply vs declining demand
This report presents five demand scenarios for global LNG through 2035 to evaluate the economic viability and expected returns of planned and/or projects under construction expanding LNG export capacity around the World. The most economically defensible segmentation of global demand assigns OECD economies a linear trajectory (infrastructure lock-in and political constraints slow renewable displacement) and a "leapfrog" trajectory to non-OECD economies (building new electricity infrastructure from scratch, where solar at $30-40/MWh defeats LNG-fired power at $80-120/MWh on pure economics with no existing gas infrastructure to protect).
Solar Deployment vs IEA World Energy Outlook Projections (GW cumulative, 2010–2024)
Every IEA World Energy Outlook from 2010 through 2022 systematically underestimated solar deployment — by a factor of two to four within just a few years of publication. Actual solar PV capacity reached 2,250 GW by 2024, more than double the IEA's most optimistic 2022 STEPS projection. The same institution's STEPS scenario underpins the investment case for $394 billion in committed LNG capacity — which is why IEA STEPS carries just 15% weight in this analysis. An institution whose solar forecasts have been structurally wrong for 15 consecutive years offers no reliable basis for 25-year LNG infrastructure decisions. Building on those projections is not conservative planning. It is a structural mispricing of risk.
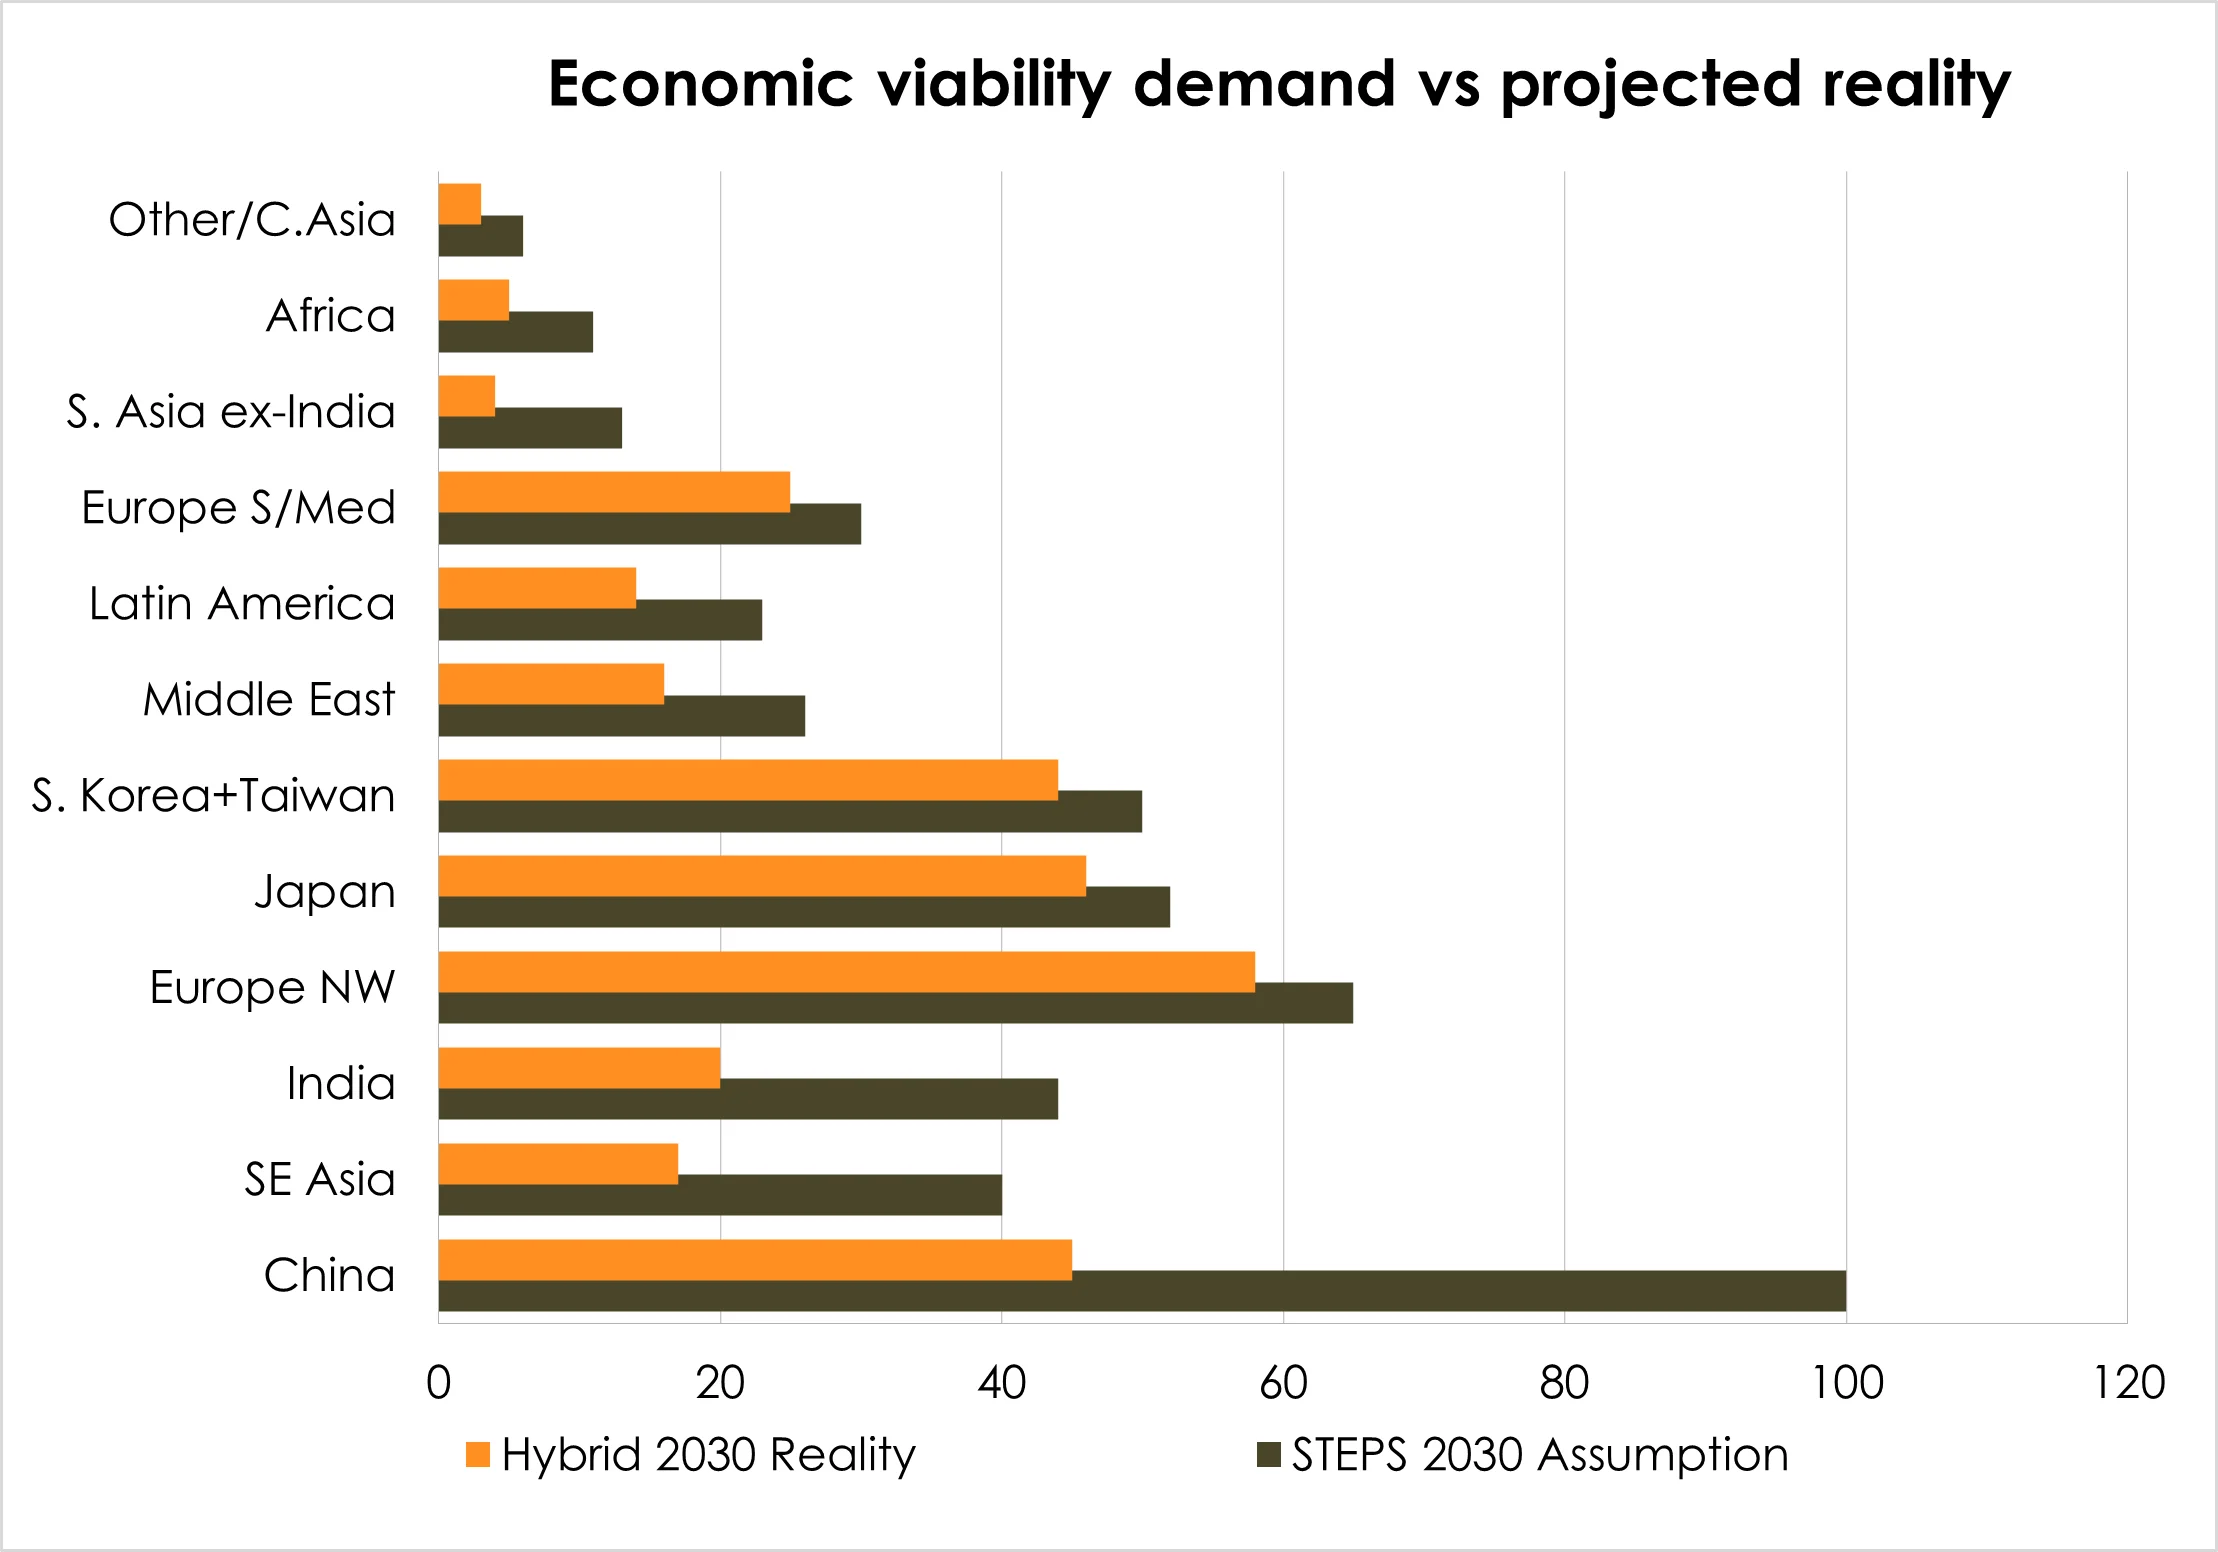
Economic Viability Demand vs Projected Reality (MTPA by region, 2030)
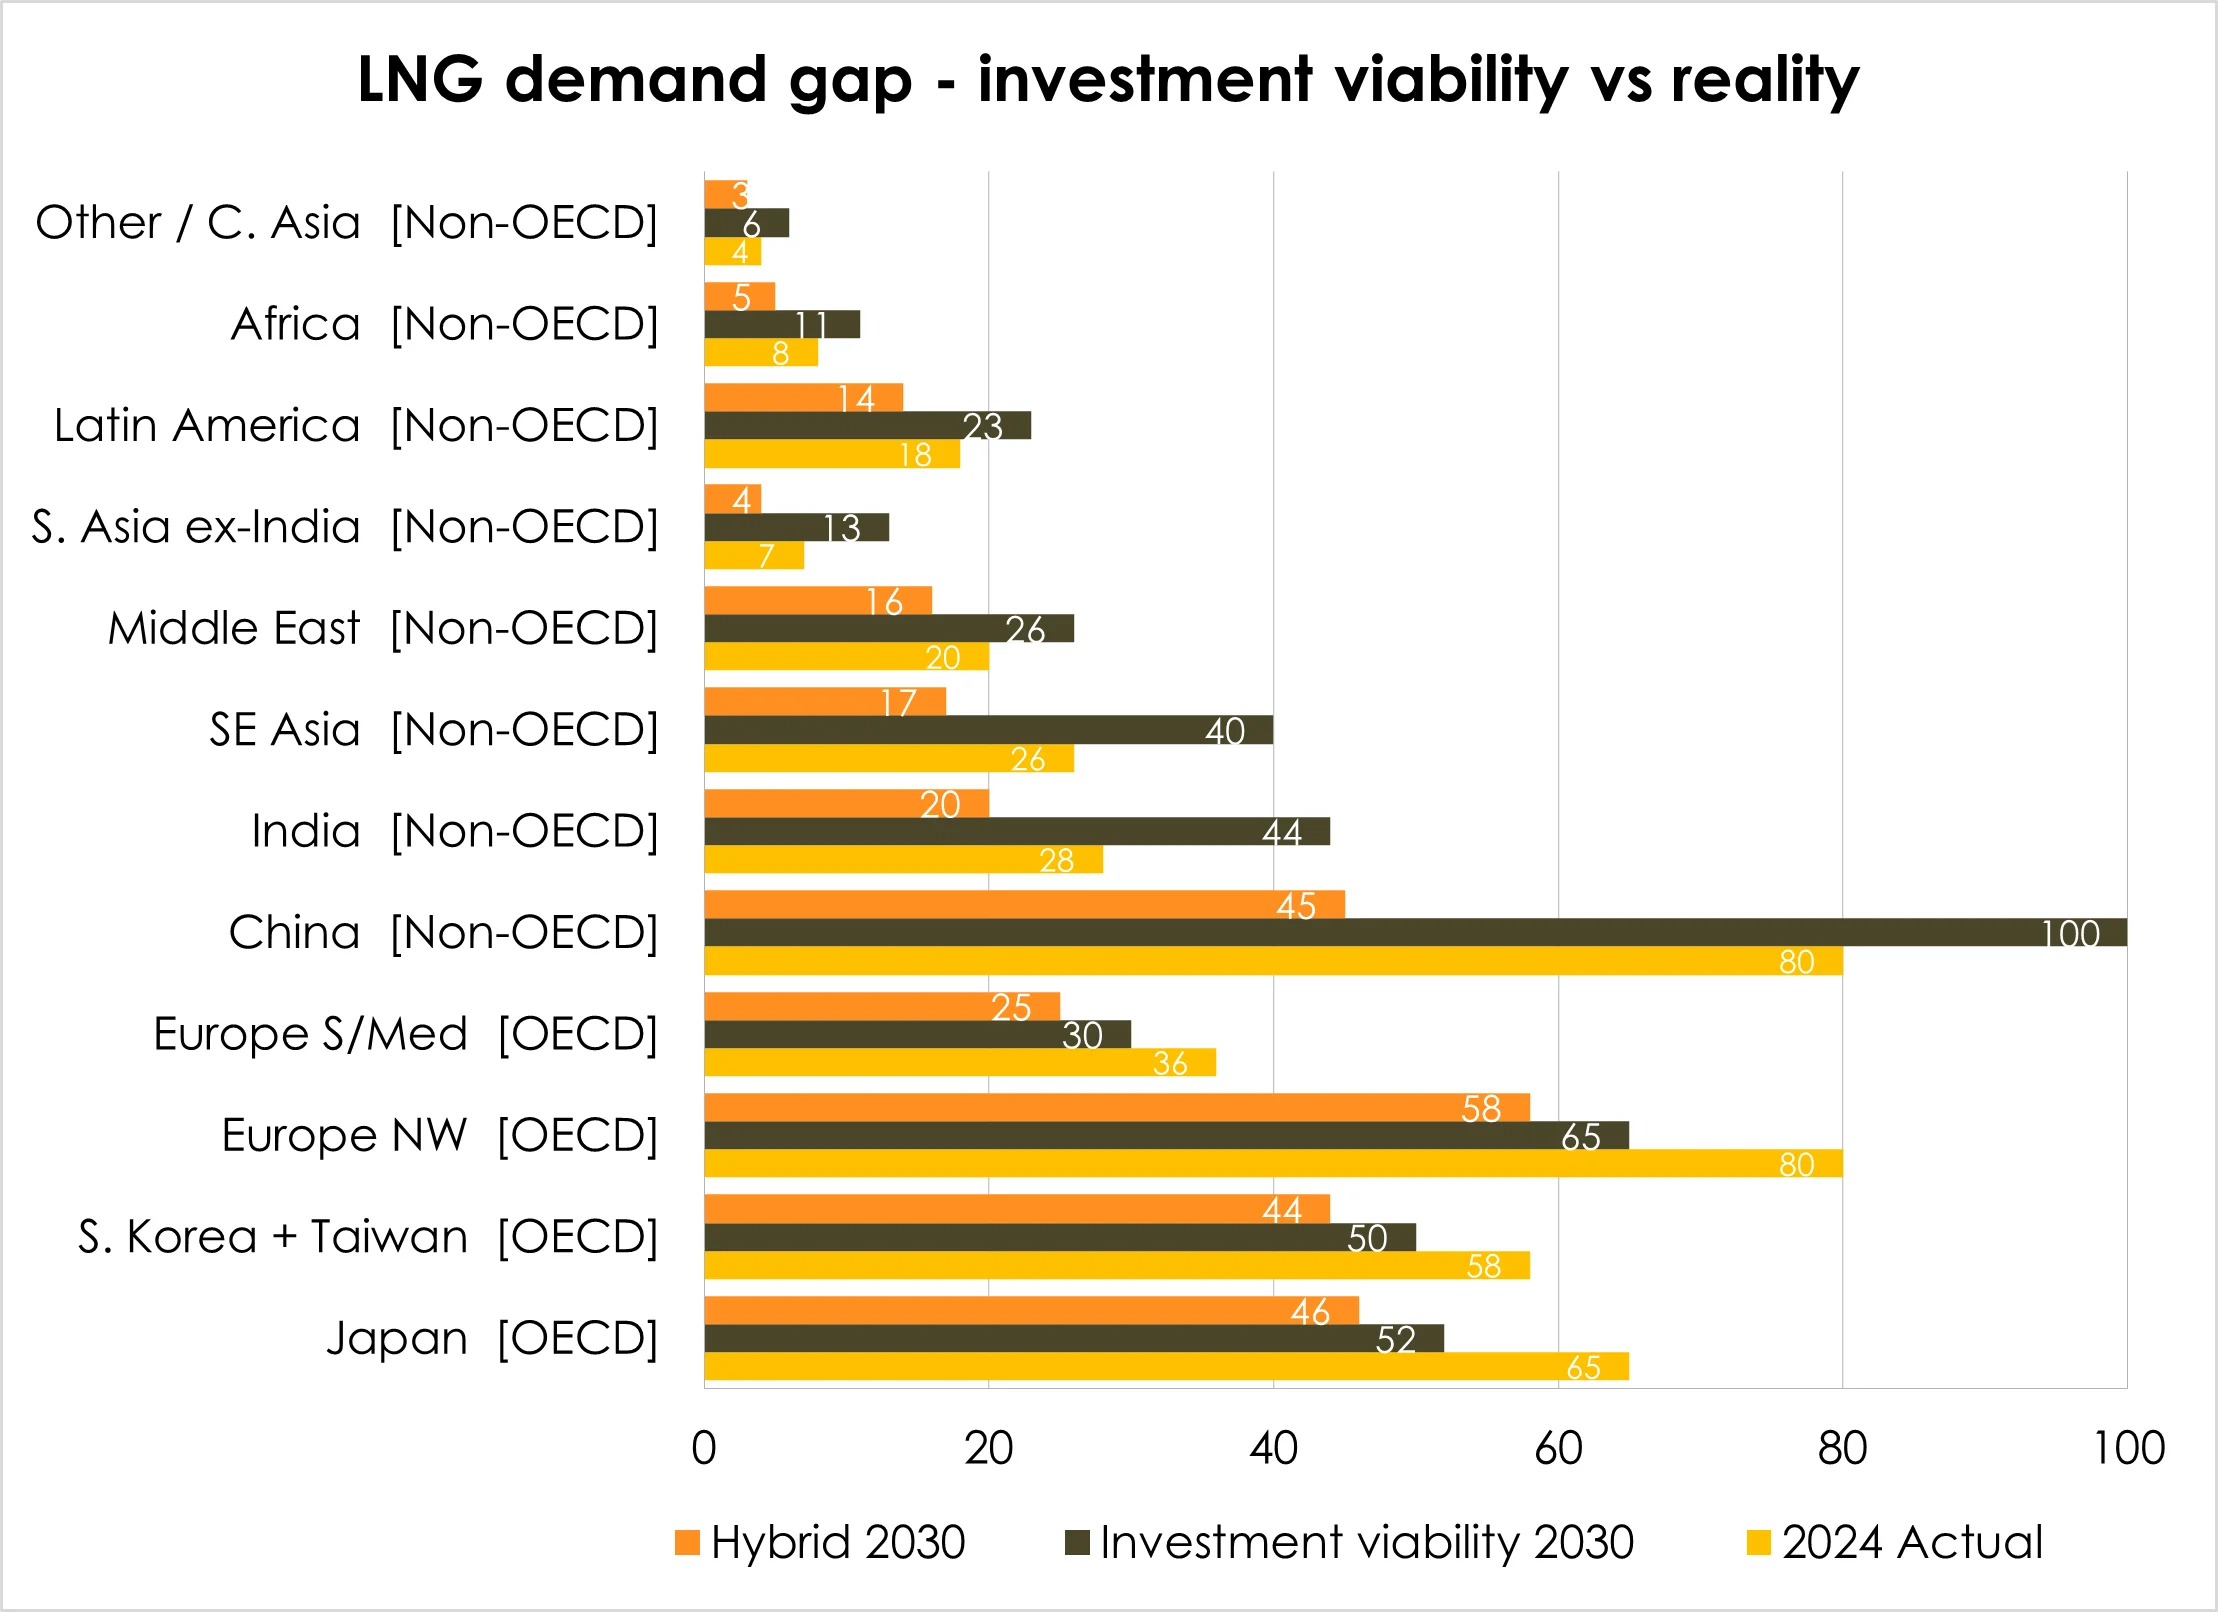
LNG Demand Gap: Investment Viability vs Reality by Region (MTPA)
Key Takeaways, based on scenario probability calculations
- the most likely scenario produces global LNG demand of approximately 297 MTPA by 2030, against supply capacity of ~575 MTPA - a structural surplus of ~278 MTPA, representing 48% of capacity under construction sitting idle.
- At that utilisation rate, LNG does not clear at project break-even points. It clears at the cash operating cost of the marginal curtailed supplier: approximately $4.50-5.50/MMBtu for US Gulf Coast projects, well below every all-in breakeven in the pipeline.
- Every US, Canadian and Australian project is loss-making on a cash-cost basis, not just on IRR.
- Qatar (breakeven ~USD 3.80-3.90/MMBtu) and UAE Ruwais (~USD 5.10) remain (marginally) profitable in all scenarios, including the leapfrog case.
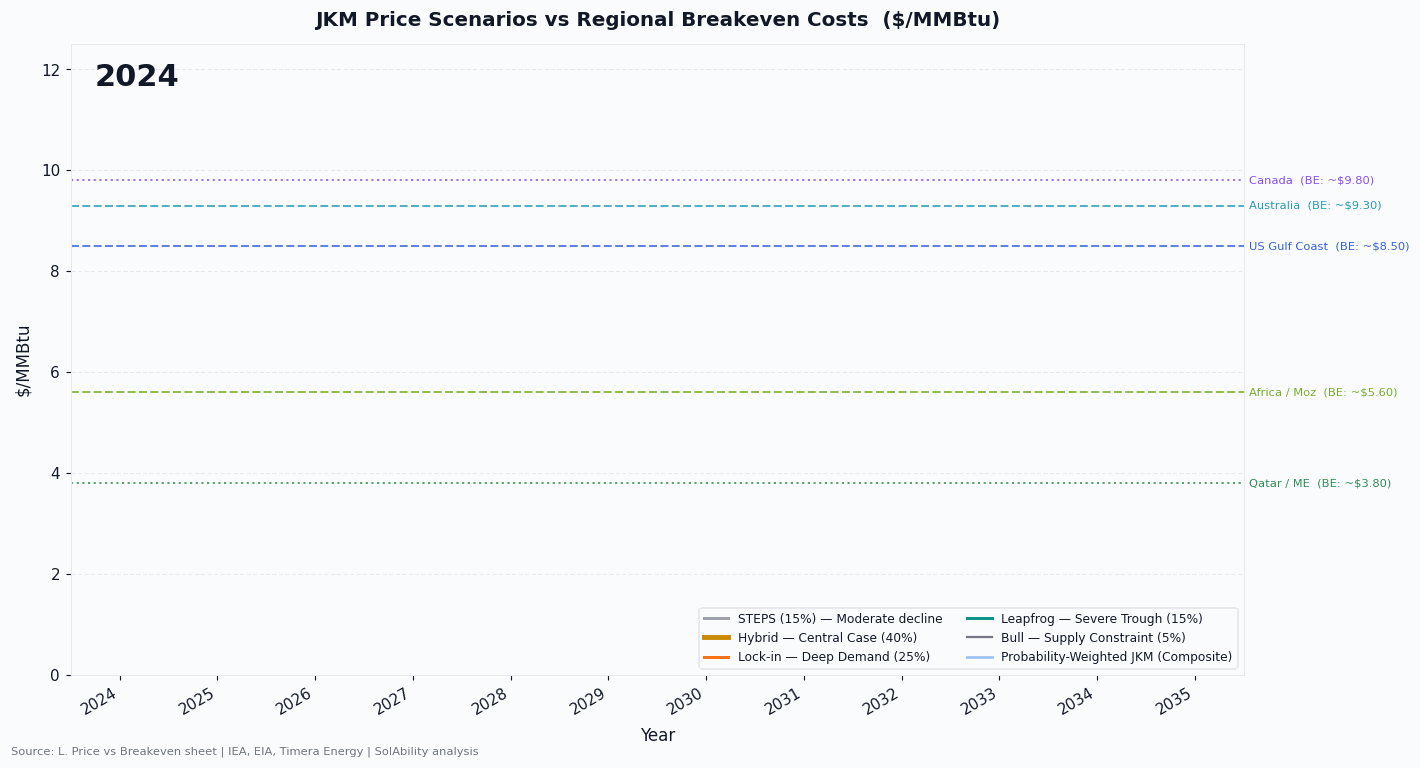
JKM Price Scenarios vs Regional Breakeven Costs ($/MMBtu)
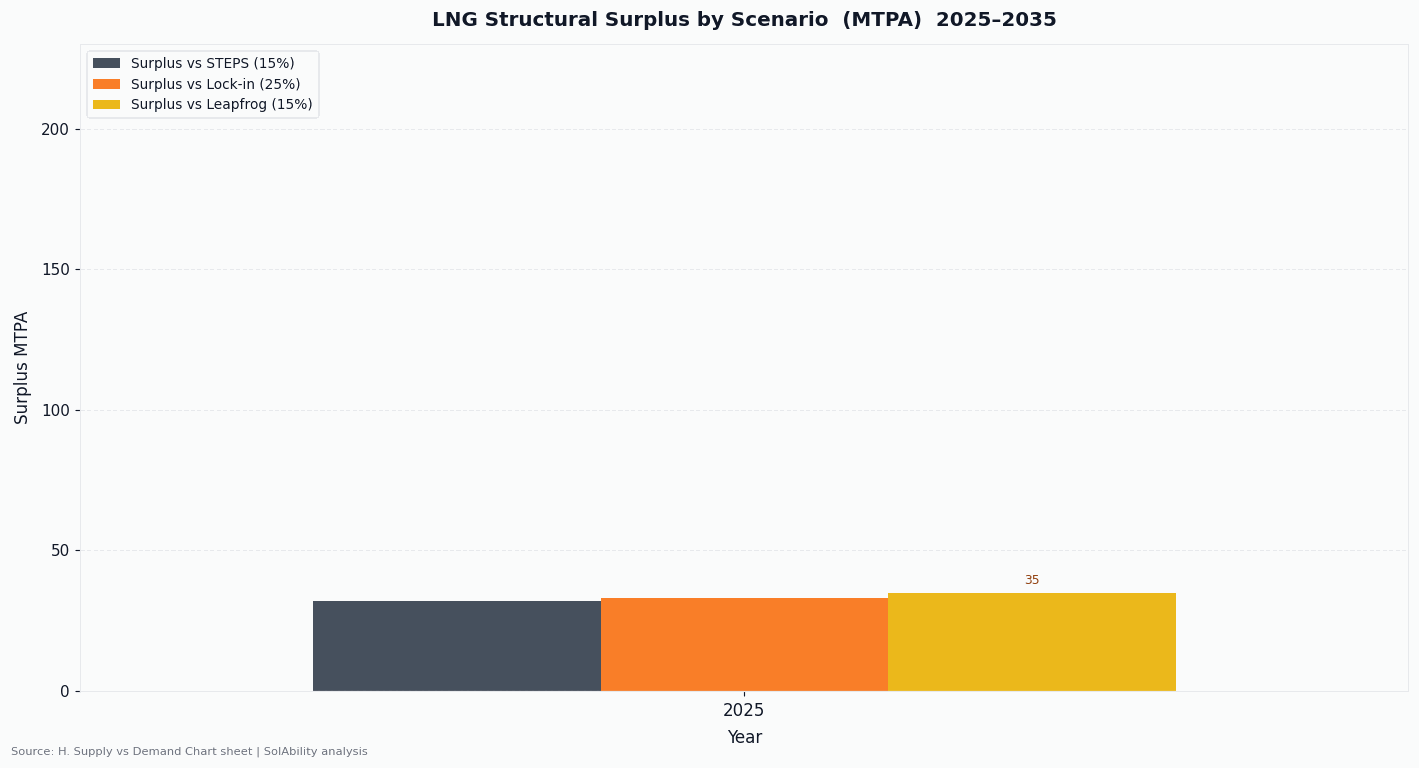
Supply-Demand Balance 2024-2035
Non-OECD economies are not choosing between LNG and renewables as a matter of climate policy. They are choosing between paying $80–120/MWh for LNG-fired power and paying $30–40/MWh for solar. This is not an energy transition story, it is a cost story — and cost stories in energy have only one ending.
Download the Full Analysis
For detailed scenario modeling, regional breakdowns, project-level economics, and comprehensive methodology, download the complete Global LNG Market Outlook 2026-2035 report.
Download Full Report