The Natural Capital of a country is defined by the natural physical environment. The Natural Capital model incorporates the essence of resources available that allow a country to be completely self-sustaining: land, water, climate, biodiversity, food production and capacity, as well as renewable and non-renewable energy and mineral resources. In addition, the level of depletion or degradation of those resources that could endanger future self-sufficiency are taken into account to reflect the full picture of the available natural capital.
The index is based on evaluating availability and abundance, quality, and status of health or deterioration of biodiversity, water, agricultural potential, soil, and the availability of natural mineral and organic resources. The index evaluates quantitative indicators only, therefore policies and environmental management systems are not included in the assessment. The Global Sustainable Competitiveness Index 2025 reveals which nations possess the natural capital essential for long-term self-sufficiency.
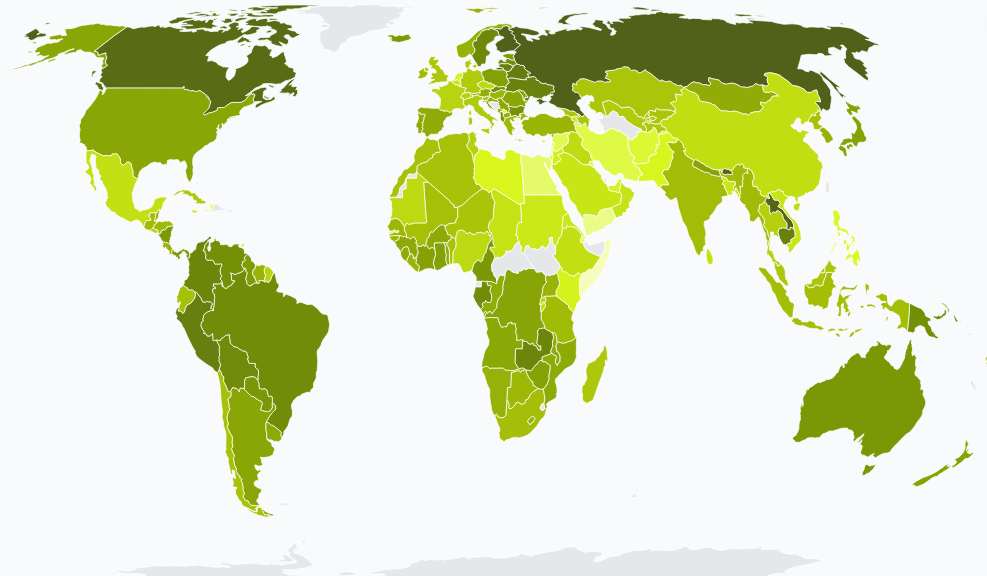
Global Natural Capital Rankings 2025
Key Findings from the Natural Capital Index 2025
- The Natural Capital Index 2025 is topped by the Russian Federation, followed by Finland, Lao PDR, and the Central African Republic. Bhutan and Canada complete the top 6.
- South American nations, with their large biodiversity pool, continue to score high in Natural Capital, with Brazil ranked #16 globally.
- Scandinavian countries, thanks to low population density, high forest coverage and the availability of water, perform well - Finland (#2) and Norway (#13) are both ranked in the top 15.
- African countries in the tropical belt are ranked fairly high – including Central African Republic (#4), Cameroon (#10), Gabon (#13), and both Congo's (Republic of Congo #15, Democratic Republic of Congo #18).
- The two most populated countries, India (#90) and China (#138), are both affected by a combination of arid climate, high population density and high natural depletion levels, raising concerns over those countries' ability to self-sustain their large populations in the long term.
- Several countries with a high population in the less developed world (for example Pakistan (#125), Egypt (#154), Iran (#164)) are performing low in Natural Capital, raising concerns about the future ability to sustain the population in the face of rapidly increasing climate disruption.
Global Natural Capital: Scores and Trends
Natural capital performance varies dramatically across nations, from minimum to ideal ecological health:

Global averages show natural capital ranges from minimum (18) to maximum (62), compared to the ideal (100), with average performance at 42—indicating substantial environmental degradation worldwide.
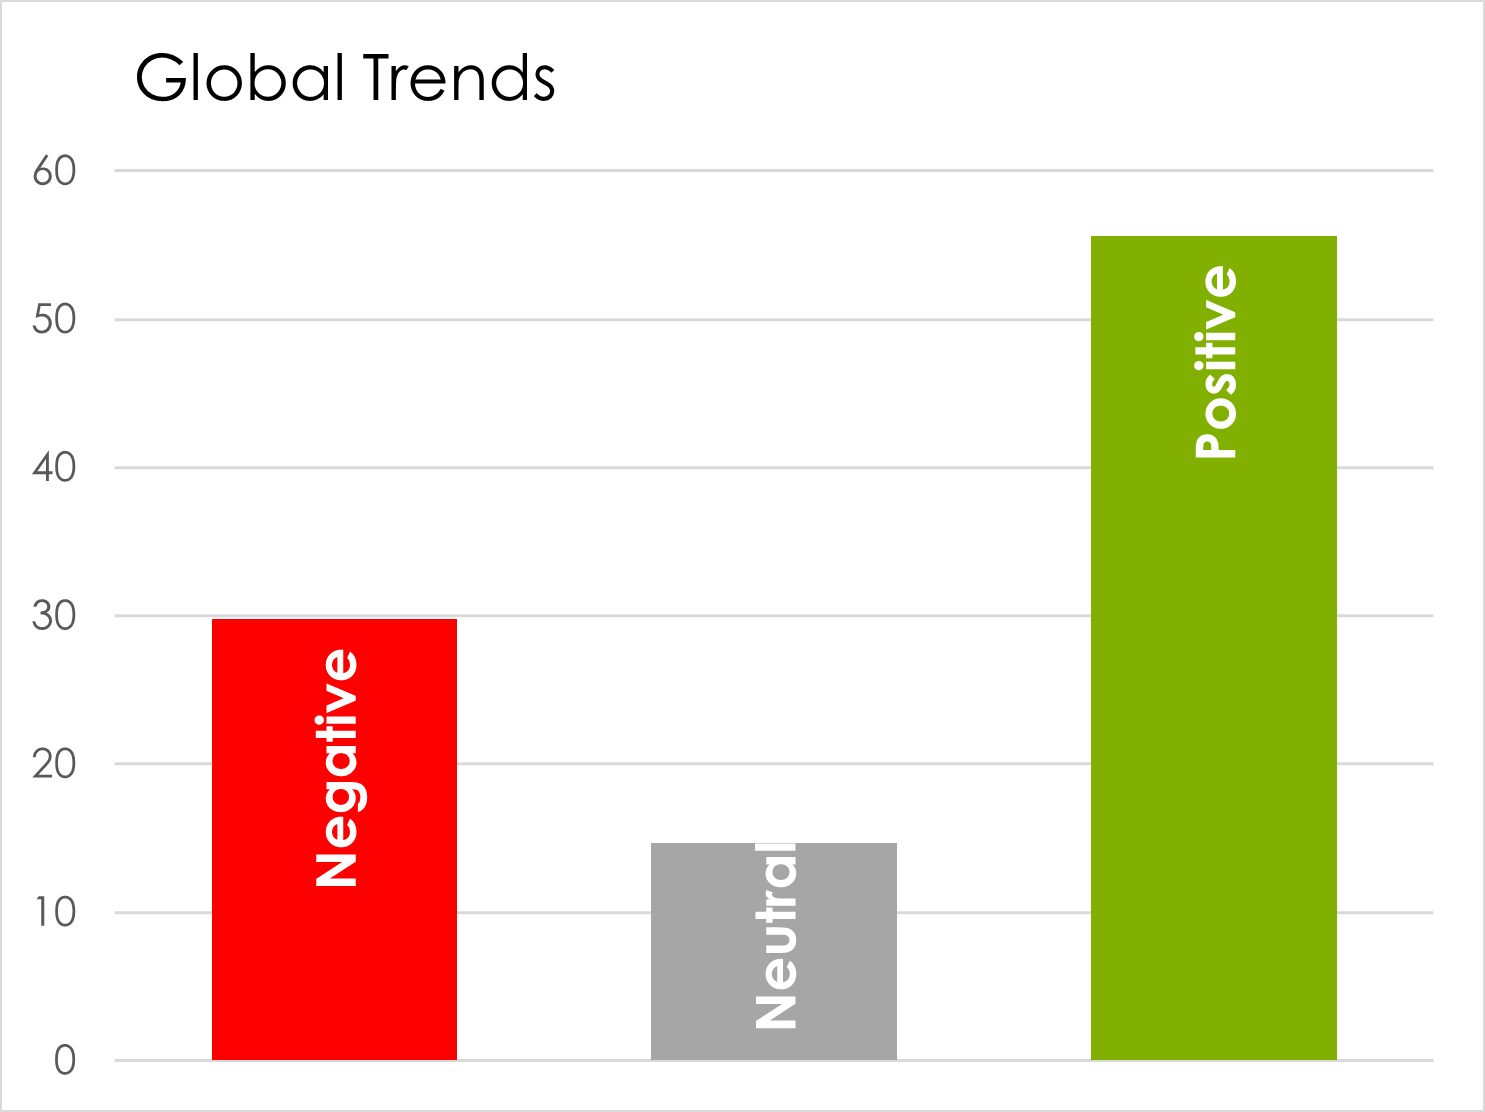
Environmental trends reveal 42% of countries show positive improvements in forest cover and air quality, while 48% demonstrate negative trends from deforestation and pollution, and 10% remain neutral.
Understanding Natural Capital Components
The Natural Capital Index evaluates multiple environmental dimensions across six core sub-indices:
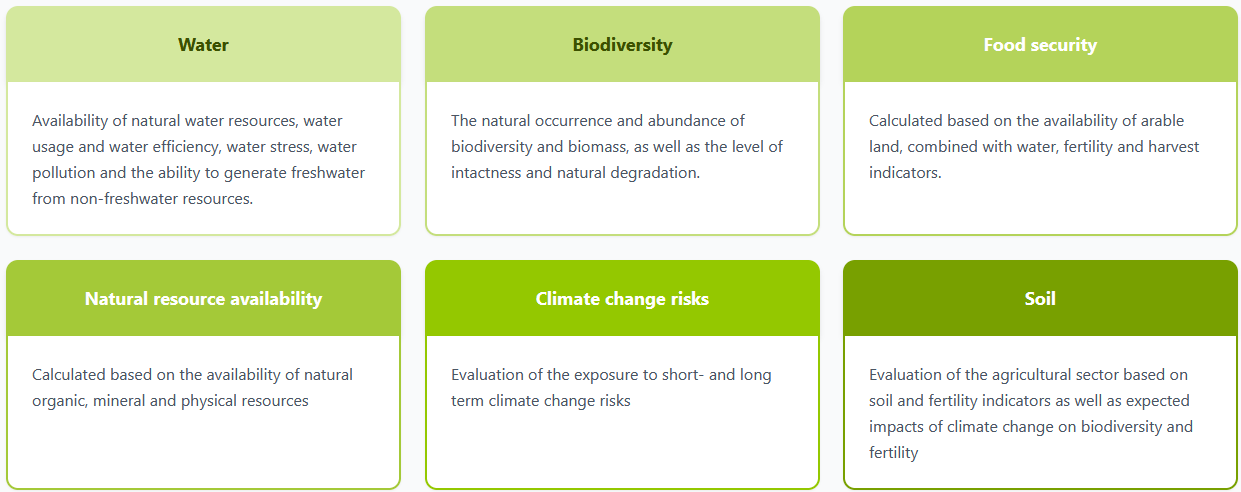
- Water: Availability of natural water resources, water usage and water efficiency, water stress and pollution, and the ability to generate freshwater from non-freshwater resources.
- Biodiversity: The natural occurrence and abundance of biodiversity and biomass, as well as the level of intactness and degradation.
- Food security: Calculated based on the availability of arable land, combined with water, fertility and harvest indicators.
- Natural resource availability: Calculated based on the availability of natural organic, mineral and physical resources.
- Climate change risks: Evaluation of the exposure to short- and long term climate change risks.
- Soil: Evaluation of the agricultural sector based on soil and fertility indicators as well as expected impacts of climate change on biodiversity and fertility.
Resource-Rich Nations: Natural Capital Leaders
High-ranking countries are characterised by abundant water availability, the source of a rich biodiversity. Many of the highest scoring countries are located in tropical areas. While some of these countries currently may lack social, intellectual and governance capital, their Natural Capital would allow them to develop sustainable competitive economies over time. A certain correlation with the level of human activities and population density can also be observed: large countries with a comparably small population density and rich biodiversity tend to score higher.
Tropical forest nations like Laos (#6), Central African Republic (#8), and Bhutan (#10) rank highly due to biodiversity-rich rainforests and limited industrial development. However, these rankings reflect natural endowment rather than sustainable management—deforestation pressures remain significant threats.
Developed Economies: Balancing Growth and Conservation
Nordic countries demonstrate that advanced economies can maintain natural capital through deliberate policy. Finland (#4) and Sweden (#23) combine strong forest industries with sustainable practices. Their success shows that economic development and environmental preservation are compatible through innovation and robust environmental governance.
However, most developed economies rank lower. The United Kingdom, Germany, and Japan face constraints from dense populations, historical deforestation, and industrial pollution legacies. Urbanization and agricultural intensification have reduced natural habitat and biodiversity.
Emerging Economies: Development vs. Conservation Trade-offs
China, India, and Brazil face acute natural capital challenges. Rapid industrialization, agricultural expansion, and urbanization have degraded air quality, depleted freshwater resources, and accelerated deforestation. China's air pollution, India's water scarcity, and Brazil's Amazon deforestation illustrate the environmental costs of development-first policies.
These nations possess substantial natural resources but face unsustainable exploitation rates. Without policy shifts toward conservation, restoration, and pollution control, environmental degradation will constrain long-term economic prospects and quality of life.
Why Natural Capital Matters for Competitiveness
- Ecosystem Services: Forests regulate climate, purify water, prevent erosion, and support agriculture—services worth trillions annually
- Resource Security: Countries with abundant natural capital face fewer supply vulnerabilities for food, water, timber, and minerals
- Climate Resilience: Healthy ecosystems buffer against extreme weather, droughts, and floods increasingly common under climate change
- Health and Productivity: Clean air and water directly impact population health, reducing healthcare costs and improving workforce productivity
- Tourism and Recreation: Natural beauty and biodiversity drive tourism revenues, particularly for nations with protected wilderness and wildlife
Natural capital is economic infrastructure
Countries that preserve and restore natural capital gain competitive advantages through ecosystem services, resource security, and climate resilience. As environmental degradation accelerates globally, nations with intact natural systems will possess strategic assets unavailable to resource-depleted competitors.
The Natural Capital Crisis
Despite growing awareness, global environmental trends remain dire. The world has lost over 420 million hectares of forest since 1990—an area larger than India. Wildlife populations have declined 69% on average since 1970. Air pollution causes over 7 million premature deaths annually. Freshwater resources face unprecedented stress from overuse and contamination.
These trends stem from economic models that treat natural capital as infinite and free. Environmental costs are externalized from prices, creating incentives for exploitation. Agricultural subsidies reward forest clearing. Energy policies favor polluting fuels. Land development ignores ecosystem value.
The Natural Capital Index 2025 demonstrates that environmental preservation and economic prosperity are interdependent. Finland and Canada show that nations can maintain substantial natural capital while achieving high living standards. Their example provides hope that restoration is possible—but requires fundamental policy shifts that value natural systems as essential economic infrastructure rather than disposable resources.
Explore Further
For detailed analysis, country-specific Natural Capital data, and comprehensive rankings, visit the Natural Capital Index or download the full GSCI 2025 Report.