First published in 2012, the Global Sustainable Competitiveness Index (GSCI) measures country-level performance based on over 280 quantitative indicators, derived from international organisations such as the World Bank, various UN agencies, the IMF. The GSCI serves as inclusive alternative to the GDP, to assess country-specific and issue-specific risks for operators and investors, and to verify development progress for government agencies. The GSCI is officially used by four national governments to benchmark their progress on the path to sustainable and competitive development.
GSCI 2025 key observations:
- Scandinavia keeps dominating the Sustainable Competitiveness Index, Finland tops
- Asia is leading the Intellectual Capital Index, North-Western Europe the Social Capital Index
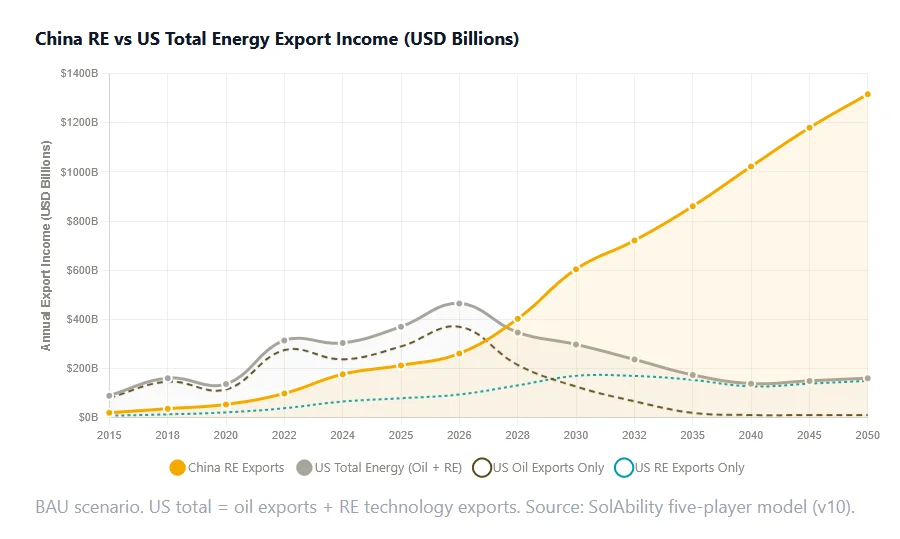
- China (ranked 34) continues to outperform the US (42)
- Significant untapped potential for win-win solutions: the highest score achieved is 60.4 (Finland), while the global average is 47.0 out of a possible 100
- Conventional sovereign bond ratings fail to fully recognise & integrate risks and opportunities
Sustainable Competitiveness
Sustainable competitiveness is the ability to generate and sustain inclusive wealth without diminishing the future capability of sustaining or increasing current wealth levels.
The Global Sustainable Competitiveness Index (GSCI) measures sustainable competitiveness based on over 280 quantitative indicators derived from international organisations (World Bank, IMF, various UN Agencies). The indicators are grouped into six foundations of competitiveness of a nation-economy:
GSCI Sustainable Competitiveness Model
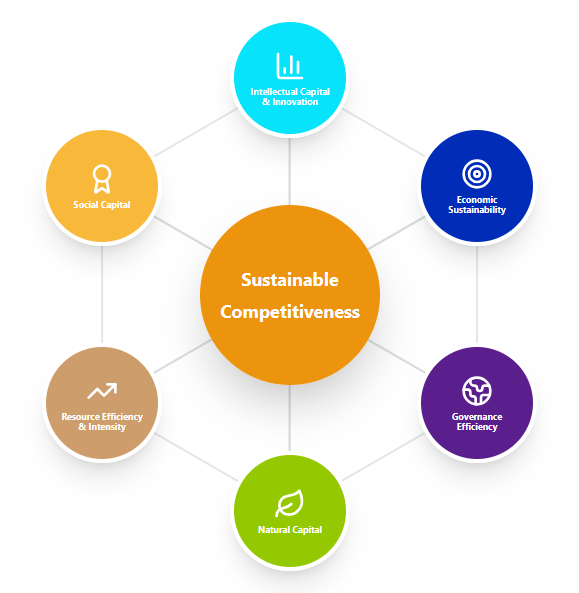
- Natural Capital Index: The given natural environment
- Resource Efficiency Index: Resource usage per capita and per economic output
- Social Capital Index: Social cohesion, health, freedom, security, equality
- Intellectual Capital & Innovation Index: Education and innovation indicators
- Economic Sustainability: Sustainable economic development, business and economic frameworks & performance
- Governance Performance Index: Infrastructure, resource allocation, corruption, and fiscal considerations
All indicators are evaluated as-is, and analysed against correlation and trends using sophisticated deep-learning AI tools. Amongst others, we use deep-learning AI-tools to analyse data correlations and trends, which in turn informs the index construction and weighting calculations. The outcome is a comprehensive view of strengths and weaknesses, as well as an indication of the direction and future potential for each country.
Key insights from the Global Sustainable Competitiveness Index 2025
- Scandinavia continues to make its mark on the Sustainable Competitiveness Index: of the top 5 spots, 4 are Scandinavian. Finland tops the Index for the first time, followed by Denmark and Switzerland. Northern European countries dominate the top 20 rankings: Japan is the only non-European country in the Top 20 (Korea follows on 23) (explore full rankings)
- Asian nations (China, South Korea, Japan, and Singapore) lead the Intellectual and Innovation Capital Index, reflecting the ongoing shift to technological leadership to Asia. The data suggest we are only seeing the beginning of this transformation
- The Social Capital Index ranking is headed by Northern European (Scandinavian) countries, the result of economic growth combined with a commonly accepted social consensus
- China is ranked 34, excelling in Intellectual Capital but lagging in Natural Capital and Resource Efficiency, albeit with encouraging signs of efficiency improvements
- The US is ranked 42, performing comparatively poor in resource efficiency and social capital, reflecting a decline that could potentially undermine the global status of the US in the future
- Germany, France, and the UK maintain strong positions in the top 15, while of the emerging economies Brazil, India, and Nigeria show varying levels of sustainable competitiveness
- Some of the least developed nations have a considerable higher GSCI ranking than their GDP would suggest (e.g. Vietnam, Colombia, Peru, Nepal, Bhutan, Bolivia)
- Countries affected by violent conflicts continue to rank at the bottom of the GSCI (eg Yemen, Sudan, Somalia, Eritrea)
- The global gap to a perfect sustainable competitive World is 53.0. We are far from an inclusive and circular society that lives in equilibrium with the natural environment
- Tribalism, distracting cultural wars, struggles for perceived personal power, and armed conflict are complicating (if not preventing) the implementation of simple, efficient, profitable and readily available solutions (explore how governance affects outcomes)
- There is immense untapped potential. Policies geared to maximise efficiency improvements could lead to significant positive developments throughout all dimensions
The Sustainable Competitiveness World Map 2025
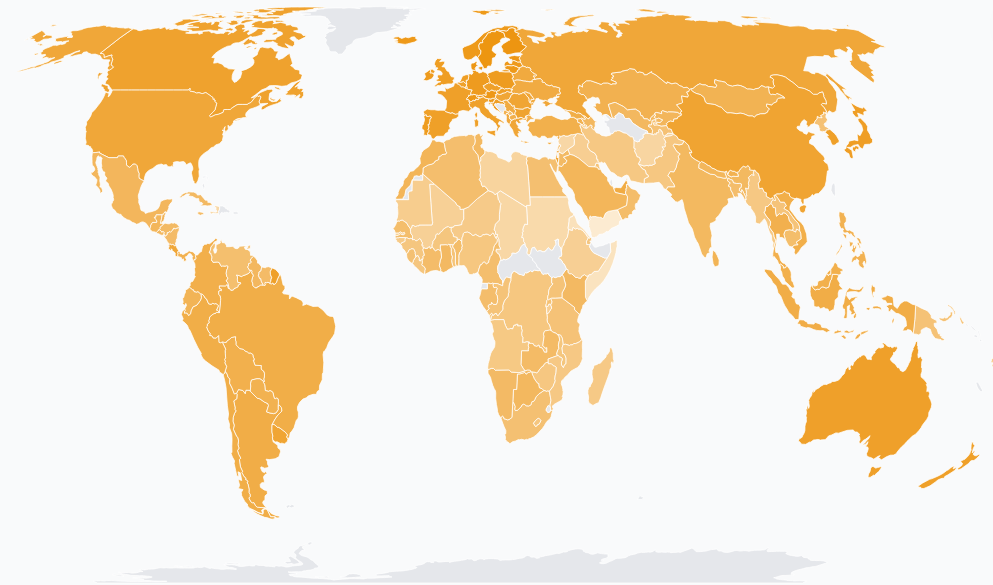
Dark colour indicates higher, light colour lower sustainable competitiveness level
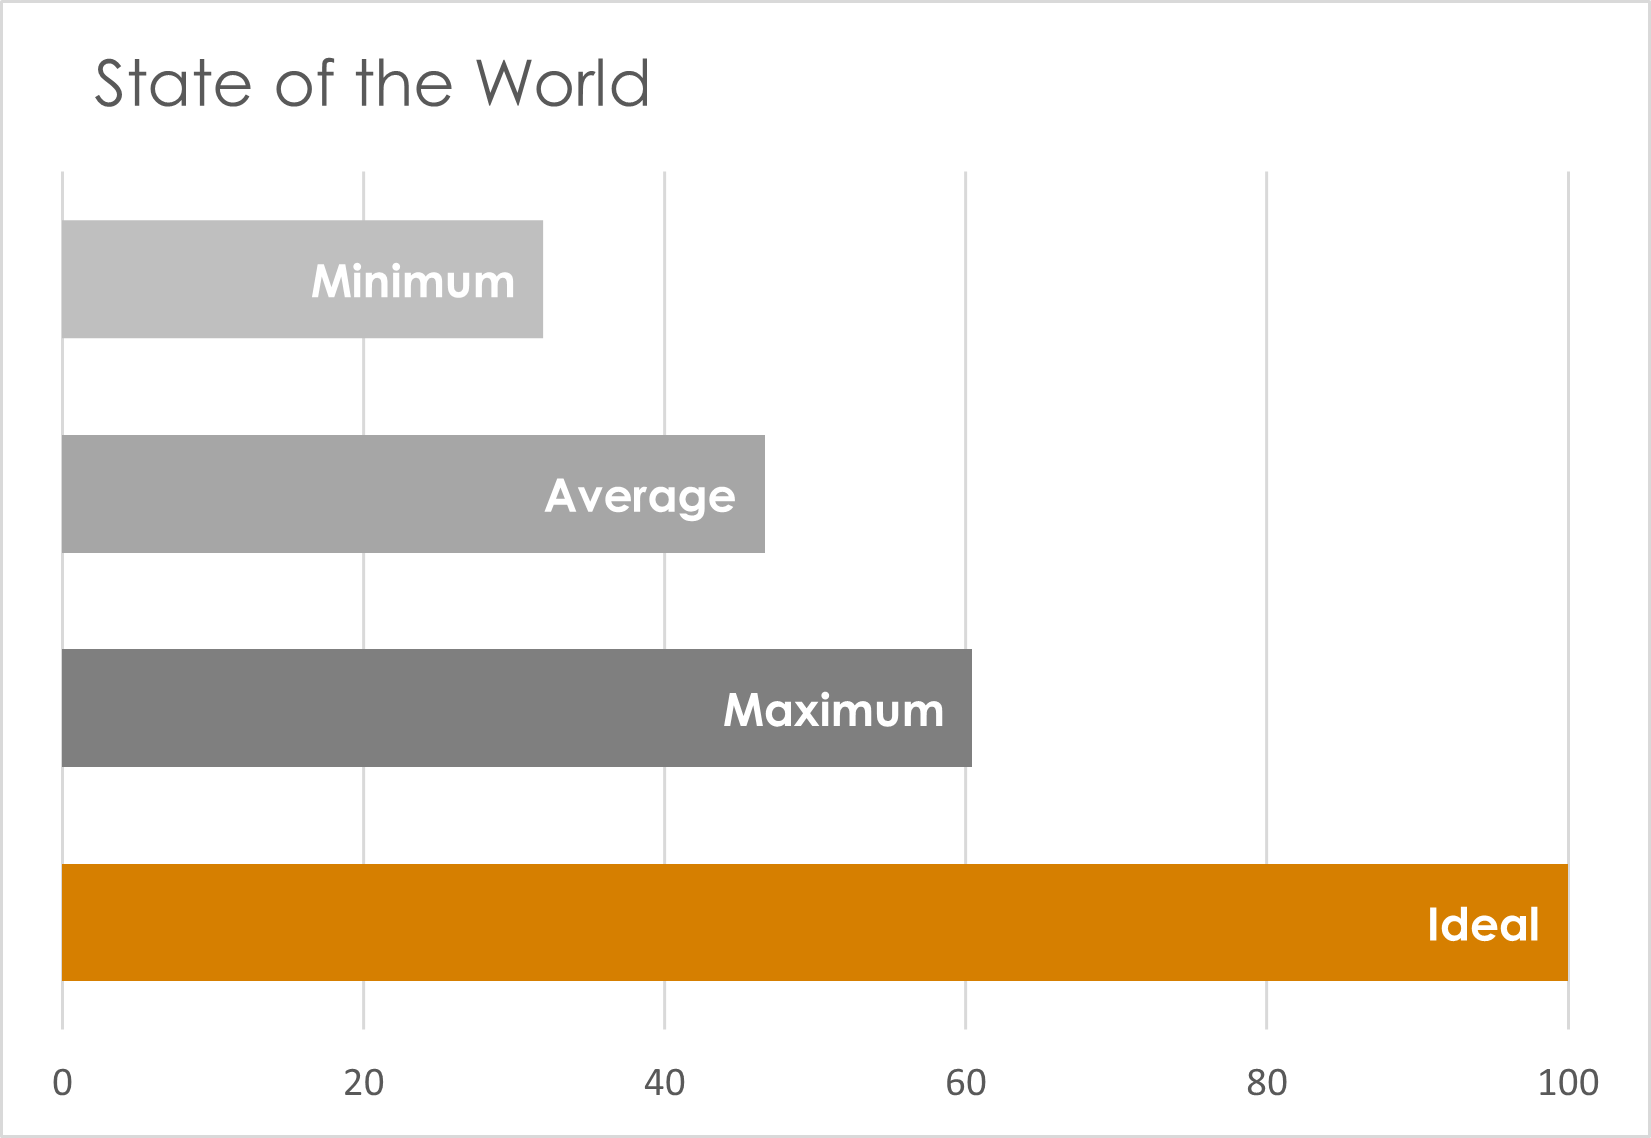
State of the World 2025
Untapped potential
The highest score achieved in 2025 is 60.4 (Finland), while the global average is 47.0 out of a possible 100 "best practice" score. The World is far from being sustainable and competitive.
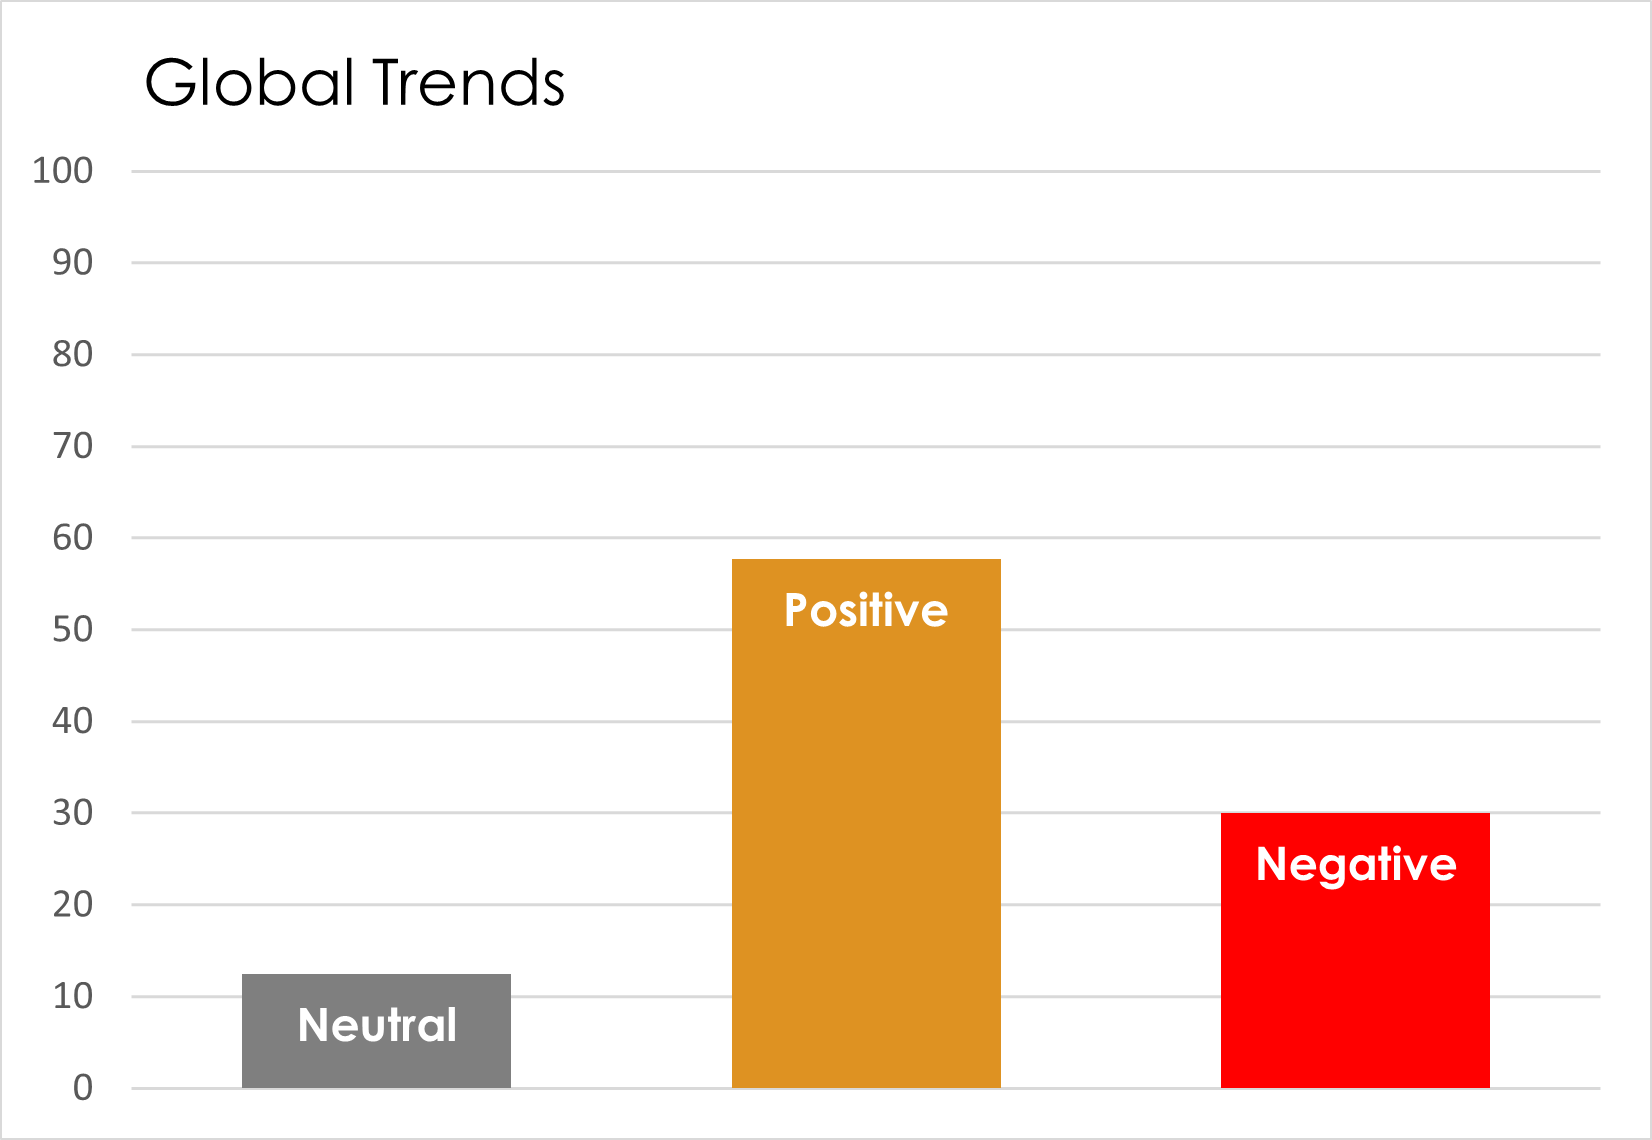
Sustainable Competitiveness Trends
A small majority (52%) of all trends across all countries are showing positive developments, indicating that we could expect slow but positive improvements under normal circumstances. However, a majority of trends in Natural Capital are deteriorating: unfortunately, we have to expect a further decline in the natural environment.
GSCI-based ESG sovereign bond ratings
Sovereign bond ratings are heavily influenced by the large rating providers – Moody's, S&P, and Fitch. A comparison of the conventionally applied sovereign bond ratings and ESG country credit ratings based on the Global Sustainable Competitiveness Index (GSCI) shows significant differences.
Under a sustainability-adjusted credit rating, countries with high reliance on exploitation of natural resources would be rated lower, while some of the lesser developed countries with a healthy foundation (biodiversity, education, governance) would receive higher ratings.
- Sovereign bond ratings do not sufficiently reflect the non-tangible risks and opportunities associated with specific nation-economies
- Sovereign bond ratings show a high correlation to GDP/capita levels, meaning poorer countries tend to carry a higher debt servicing burden and higher interest rates than richer economies
- Sovereign bond ratings can facilitate a negative circularity: bad credit ratings lead to higher cost of capital and debt servicing, which in turn leads to bad credit ratings
Learn More About ESG Sovereign Bonds
Explore comprehensive ESG-adjusted credit ratings and detailed analysis comparing conventional ratings with sustainability-focused assessments.
View ESG Sovereign Bonds AnalysisExplore the Full Index
Access comprehensive rankings, dimension analysis, and interactive data for 193 countries.
View the GSCI Interactive Index