The effective closure of the Strait of Hormuz, the world's most critical energy chokepoint, has stranded approximately 75% of Gulf countries and Iraq energy exports, triggering the largest supply disruption since the 1973 Arab oil embargo. This analysis models three scenarios based on the length of the US/Israel – Iran conflict (ending now, mid-March 2026, prolonged by 2 more weeks, or 3 months) and the impact of those scenarios on global GDP, inflation and regional growth outcomes. It is based on IMF oil-price inflation calculation methodologies, as well as on economic regression modelling taking into account the oil, LNG and fertiliser supply shocks.
On April 7, a two-week ceasefire between the United States and Iran was announced. Within hours, Iranian state media reported the Strait of Hormuz had been closed again, with vessels attempting transit coming under fire. The White House called it “completely unacceptable.”
This sequence matches the phantom ceasefire scenario modelled in our daily cost tracker: a ceasefire is declared in political terms while the physical strait remains blocked. The economic damage continues to accumulate at approximately $20 billion per day. Supply recovery lags are detailed in our fuel supply analysis: even a genuine reopening needs three months before diesel and jet fuel markets normalise. Countries with high renewable electricity shares are absorbing a measurably smaller shock. See the Renewable Energy Shield analysis for country-level exposure data across 34 economies.
The GDP scenarios below remain valid. The short-conflict outcome is no longer achievable given elapsed time. The phantom ceasefire path, with cumulative losses in the $3.57T range, is now the base case.
The Strait of Hormuz: The Chokepoint in Context
Approximately 20 million barrels per day, roughly one-fifth of globally traded petroleum, flow through the 33-kilometre-wide Strait of Hormuz at its narrowest point. Six Gulf Cooperation Council states and Iraq depend on this corridor for the overwhelming majority of their hydrocarbon export revenues. Iraq alone exports over 3.3 million barrels per day through its southern Gulf terminals, making it the second-largest OPEC producer after Saudi Arabia. The strait also carries the world's largest volumes of liquefied natural gas, primarily from Qatar, for which no pipeline alternative exists.
The USA/Israel-Iran-Gulf conflict, escalating through March 2026, has created conditions not seen since the Tanker War of 1987–88. Unlike that episode, however, the current disruption coincides with deliberate targeting of energy infrastructure - refineries, desalination plants, and port facilities - rather than interdiction of shipping alone. The economic consequences compound across multiple simultaneous channels: export revenue loss, non-oil sector collapse, and global commodity price transmission.
A structural asymmetry distinguishes this crisis from prior oil supply shocks: Gulf producer states cannot benefit from rising oil prices because they cannot deliver product to market. The standard economic model, in which oil exporters gain from price rises, inverts entirely when the export route is severed. Saudi Arabia and the UAE retain partial bypass capacity through overland pipeline infrastructure; all other GCC states have none.
“The standard assumption that oil exporters benefit from rising prices breaks down completely when producers cannot ship. Gulf states are net losers under every scenario modelled.”
Second-Order Effects
Shipping & insurance
- —War-risk insurance premiums have risen 300–500% for vessels transiting the northern Gulf
- —Lloyd's of London has suspended cover for vessels entering designated war zones
- —Container freight rates ex-Asia surging as re-routing via Cape of Good Hope adds 10–14 days
- —Oman and UAE ports partially operational but at reduced capacity under drone threat
Financial markets & FDI
- —Gulf sovereign wealth funds - ADIA, PIF, QIA - drawing on reserves to fund state budgets
- —Foreign direct investment into GCC states suspended pending conflict resolution
- —Gulf equity markets have fallen 15–35% from pre-war levels across all six exchanges
- —Credit default swap spreads on GCC sovereign debt have widened materially
Food & water security
- —Around 37-38M people drink water from Gulf-coast desalination plants; up to 99% in Qatar, Kuwait, Bahrain and UAE
- —Desalination plants require continuous power, fuel supply interruptions create cascading risk
- —Gulf states import 80–90% of food; Hormuz closure affects refrigerated vessel access
- —UN agencies have flagged humanitarian risk if conflict extends beyond 4 weeks
LNG market dislocation
- —Qatar produces 81M tonnes/year of LNG, approximately 22% of global supply
- —European LNG prices (TTF) have spiked 180% from pre-war levels
- —Japan and South Korea, 100% LNG import-dependent, face acute Q2 supply gaps
- —US LNG exporters (Sabine Pass, Corpus Christi) are the only immediate swing suppliers
Iraq is not a Gulf state, but its fiscal trajectory is faster and more acute than any GCC economy. Unlike GCC sovereigns with trillion-dollar sovereign wealth funds, Iraq has no buffer: oil revenues fund 90% of state income, there is no approved 2026 budget, and the government is operating on emergency monthly spending rules. Iraq entered this crisis with a budget breakeven oil price of $84/bbl — with Brent now at ~$92 and exports collapsed to under 800,000 bpd, the fiscal mathematics deteriorate rapidly. Branch-level liquidity rationing is already under way. Salary payment stress becomes realistic within 2–4 months if Hormuz stays shut. A senior Iraqi oil ministry official described the situation as “the most serious operational threat Iraq has faced in more than 20 years.”
Parallels and Divergences
| Episode | Duration | Supply disrupted | Global GDP impact | Key differentiator |
|---|---|---|---|---|
| 1973 Arab Oil Embargo | 5 months | ~7% of world supply | −2.5% (OECD) | Voluntary restriction; no infrastructure damage |
| 1979 Iranian Revolution | 12 months | ~4% of world supply | −1.8% (global) | Gradual escalation; Saudi spare capacity deployed |
| 1987–88 Tanker War | 18 months | Shipping risk; flow continued | Minimal | Interdiction only; production continued onshore |
| 1990–91 Gulf War (Desert Storm) | 7 months | Kuwait + Iraq offline (~9% world) | −0.5% (global) | Oil spiked $17→$40+; reversed when war ended in weeks; Saudi spare capacity cushioned shock |
| 2003 Iraq War | 3 weeks (combat) | ~3% world supply disrupted | −0.2% (global) | Short combat phase; prolonged insurgency kept prices elevated through 2000s; no Hormuz risk |
| 2026 USA/Israel-Iran-Gulf Conflict | Ongoing | 15.8M bpd stranded (15% world) | −0.54% to −3.15% | Infrastructure targeted; exporters cannot ship; LNG shock + fertilizer cascade compound oil channel; no spare capacity buffer |
Assessment
The United States possesses overwhelming conventional firepower, sufficient to destroy the majority (if not all) of Iran's military-industrial infrastructure, port facilities, and command nodes within days. However, conventional superiority does not translate into the ability to eliminate Iran's attack potential. Asymmetric warfare, conducted through dispersed, highly mobile, low-cost platforms such as the Iranian Shahed drones, is structurally resistant to conventional military resolution. A quick end to the conflict through military means is therefore not in sight.
The economic transmission of the Hormuz disruption to global GDP operates through three distinct but reinforcing channels: direct commodity price transmission (the IMF coefficient), financial market contagion (equity and debt repricing, FDI suspension), and real sector disruption (manufacturing input costs, food price inflation). These channels compound non-linearly as duration extends.
The critical analytical distinction from prior oil shocks is the inversion of the producer-exporter windfall. Gulf states, which in prior episodes benefited from price rises even as geopolitical tensions mounted, face simultaneous revenue collapse, infrastructure damage, and fiscal reserve drawdown in the current scenario. Saudi Arabia's Vision 2030 non-oil revenue diversification strategy, while partially protective, does not offset the scale of hydrocarbon revenue loss at current bypass constraints.
For global portfolios, the principal risk pathway is stagflation: rising commodity and food prices compressing consumer purchasing power while central banks face the dilemma of responding to inflation at the cost of growth. The 1973–74 episode resolved into a prolonged period of stagflation that persisted well beyond the embargo's end. A 3–6 month Hormuz closure would create comparable structural conditions.
Watching from the Sidelines
For the countries not involved in the conflict, the situation presents a stark asymmetry: substantial economic damage absorbed through energy price inflation, supply chain disruption, and financial contagion - but few direct levers to alter the trajectory of events. The world is watching from the sidelines, heavily affected and largely unable to determine the outcome. Yet inaction is not the only option.
The strategic calculus for third-party military involvement is unfavourable for all parties. Non-GCC states should limit engagement to defensive support, maritime protection of commercial shipping where legally permissible, and civilian protection operations. Physical escalation carries the most severe risk: triggering the prolonged-conflict scenario that causes the deepest and most durable global economic damage.
The single most effective economic intervention available to non-combatant states is coordinated, persistent diplomatic pressure, both public and through back-channel engagement, directed at accelerating a ceasefire. Every additional week of Hormuz closure adds cumulative and partly irreversible economic damage. The IMF, World Bank, UN Security Council, and G20 have the standing and the obligation to frame this as a global economic emergency requiring immediate diplomatic resolution. Pressure on all parties, including the United States, to halt offensive operations must be exercised with urgency and without ambiguity.
The Iran–Gulf crisis makes visible what structural energy data has shown for years: dependence on fossil fuel supply chains that can be severed by a handful of actors at any time is not merely an environmental liability - it is an acute economic and national security vulnerability. The most durable insurance against future disruptions of this kind is the deliberate, accelerated build-out of domestic renewable energy infrastructure. Solar, wind, and battery storage, at current costs, are economically superior to imported fossil fuel alternatives in the vast majority of markets. Countries that have begun this transition are measurably less exposed. Countries that have not remain hostage to chokepoints, tanker routes, and geopolitical risk beyond their borders.
The long-term lesson extends beyond energy policy. Countries that invest in natural capital, knowledge, institutional quality, social cohesion, and resource efficiency, the dimensions measured by the Global Sustainable Competitiveness Index, are structurally more resilient to external shocks. Energy self-sufficiency is one component of a broader architecture of competitive sustainability: economies that are not dependent on imports of depletable resources controlled by volatile geopolitical actors are both more sustainable and more competitive over the long run. The current crisis is a stress test that exposes the hidden costs of deferred transition, and the compounding benefits of having acted earlier.
The USA/Israel-Iran-Gulf conflict is, in the end, a demonstration of what energy dependency costs, measured in economic output foregone, investment diverted, and growth delayed. The countries best placed to weather it are those that have already begun reducing that dependency. The countries most damaged are those that have not. This is not coincidence: it is the structural argument for sustainable competitiveness as a national strategy, not merely an aspiration.
The Card Nobody Wants to Talk About: Water
It is not only the oil and the Strait of Hormuz. Unfortunately, the Iranian regime holds an even more powerful card: water.
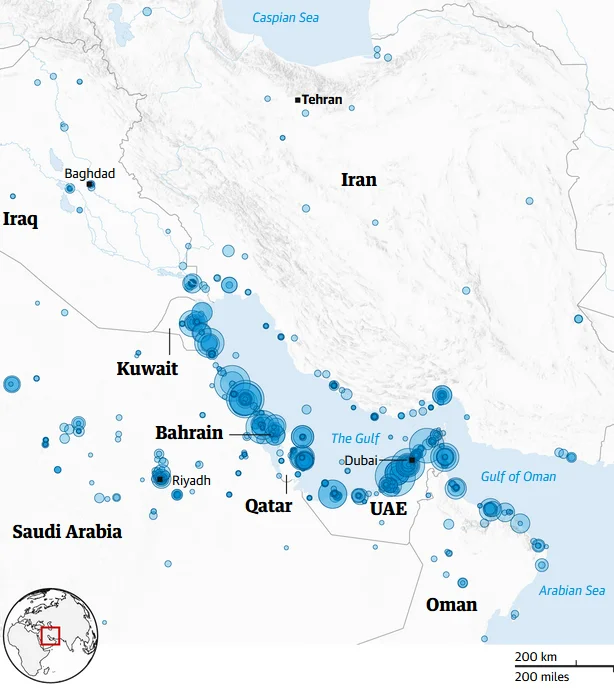
The map above shows desalination plants along the Gulf coastline. An estimated 37-38 million people depend on desalination plants for drinking water - virtually 100% of the population in Qatar, Kuwait and Bahrain, and the large majority in the UAE. Saudi Arabia has partial redundancy through Red Sea plants serving Jeddah, Mecca and Medina, but its Gulf coast mega-plants at Jubail and Ras Al-Khair supply Riyadh and the Eastern Province - home to over 13 million people. Oman's Gulf of Oman plants sit outside the Strait but within range of the same drone systems. Every Gulf coast plant sits within range of Iranian Shahed drones.
| Country | Pop. served by Gulf-coast desal. | Notes |
|---|---|---|
| Saudi Arabia | ~13-14M | Gulf coast plants (Jubail, Ras Al-Khair) serve Riyadh and Eastern Province. Red Sea plants serve Jeddah, Mecca, Medina. |
| UAE | ~10.4M | All major desalination plants are on the Gulf / Arabian Gulf coast. |
| Kuwait | ~4.4-4.9M | All plants on Gulf coast; virtually 100% dependency. |
| Qatar | ~2.9M | All plants face the Gulf; no alternative water source. |
| Bahrain | ~1.4M | Island state; entirely Gulf-coast dependent. |
| Oman | ~4.0M | Gulf of Oman coast, outside Hormuz - but Duqm and Salalah plants within drone range. |
| Total | ~37-38M | People depending on desalination plants for drinking water |
Water is not a business input, it is life. Without water, millions of people would face immediate evacuation to other countries. The gleaming hotels, financial centres, conference districts, and aviation hubs that define Gulf cities become irrelevant within days. And the question that no financial model has yet priced: how would global stock markets - and in their wake the global economy - respond to the forced displacement of tens of millions of people from the world's largest hydrocarbon corridor?
The strategic logic is straightforward and brutal. Targeting water infrastructure does not require precision strikes on hardened military assets. It requires drones that Iran already possesses, aimed at civilian facilities that cannot be easily replaced or relocated.
“Whoever drew up — and whoever approved — the plans for this war of choice forgot to think beyond the first bomb. Every day the bombing continues is, and it cannot be said otherwise at this stage, pure insanity.”
Frequently Asked Questions
About the Iran war's impact on GDP, inflation, and the global economy