The Resource Index measures how efficiently countries utilize natural resources. It combines Resource Intensity (resources consumed per person) and Resource Efficiency (how effectively countries extract economic value from resources). The Global Sustainable Competitiveness Index 2025 reveals which nations are leading—and lagging—in the transition to resource-efficient economies.
Global Resource Usage Rankings 2025
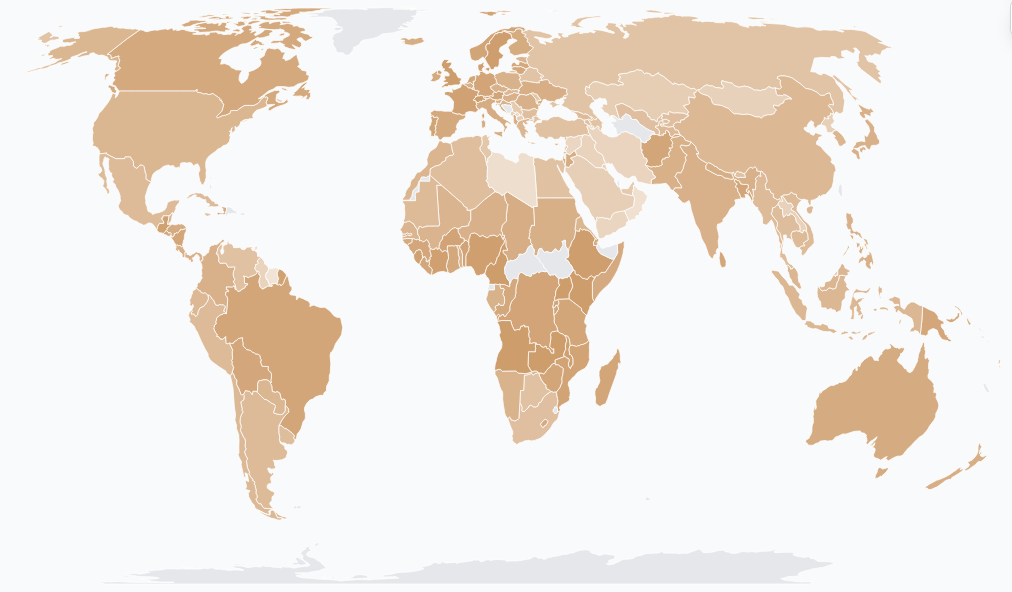
Key Findings from the Resource Usage Index 2025
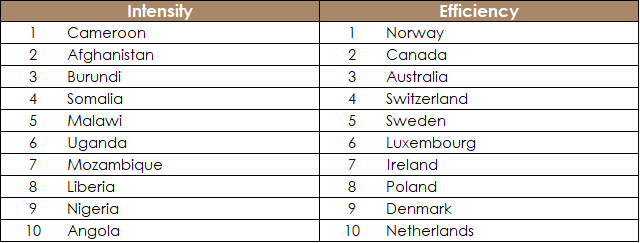
- The Intensity Index (per capita resource consumption) is topped by less developed countries.
- The Resource Efficiency Index (resource use per economic output) is led by advanced economies transitioning to service sectors (and the loss of the manufacturing sector due to lack of competitiveness).
- Uganda ranks first in the combined Resource Efficiency/Intensity Index, followed by Angola, Zambia, Cameroon (all with very low per-capita consumption), and the United Kingdom.
- Among major economies, the UK (#5) leads, followed by France (#15) and Germany (#23). Japan ranks 83rd and the US 99th.
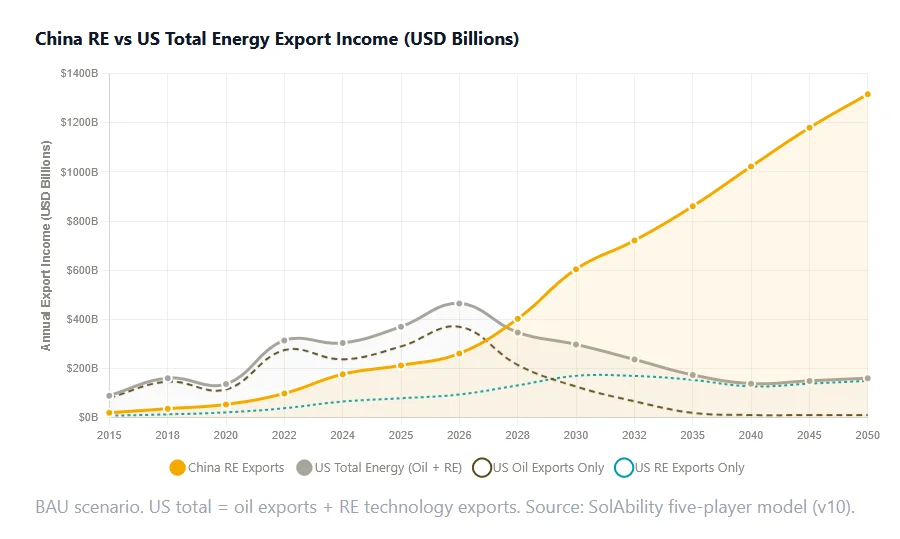
- China (#111) is hindered by heavy industries and construction, though it continues to show efficiency improvements despite rising intensity challenges.
Global Resource Efficiency: Scores and Trends
Global resource efficiency varies widely across nations, from minimum to ideal performance:
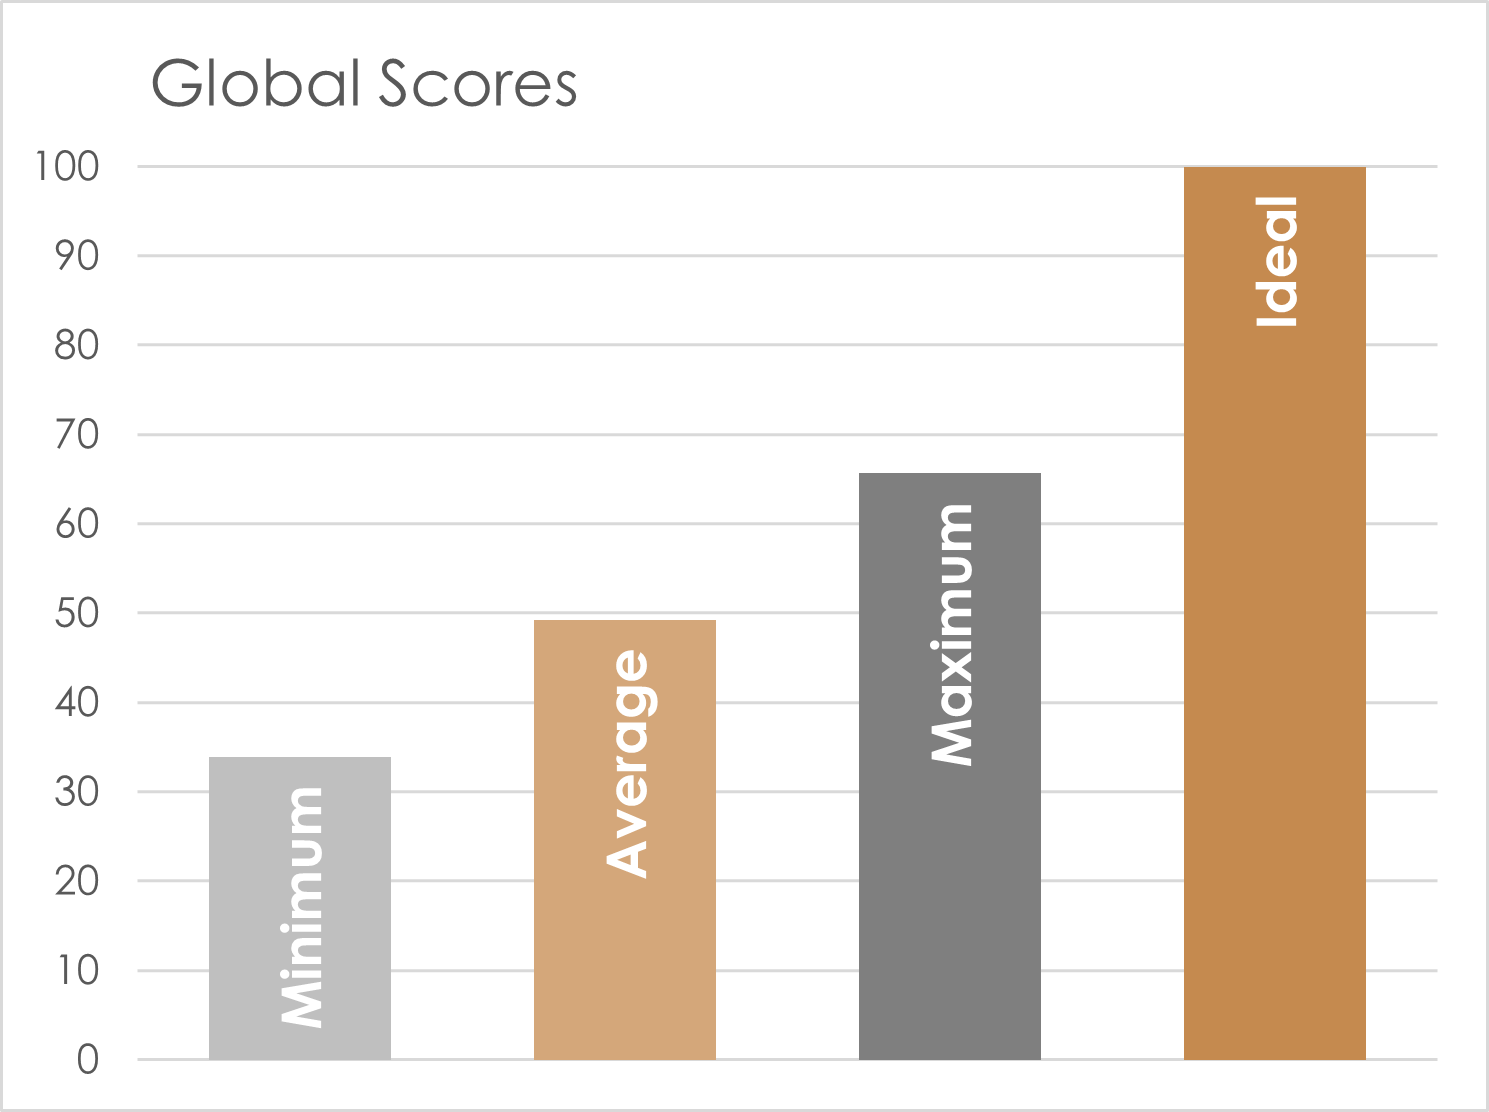
Global averages show resource efficiency ranges from minimum (35) to maximum (66), compared to the ideal (100), with average performance at 49—indicating significant room for improvement across most nations.
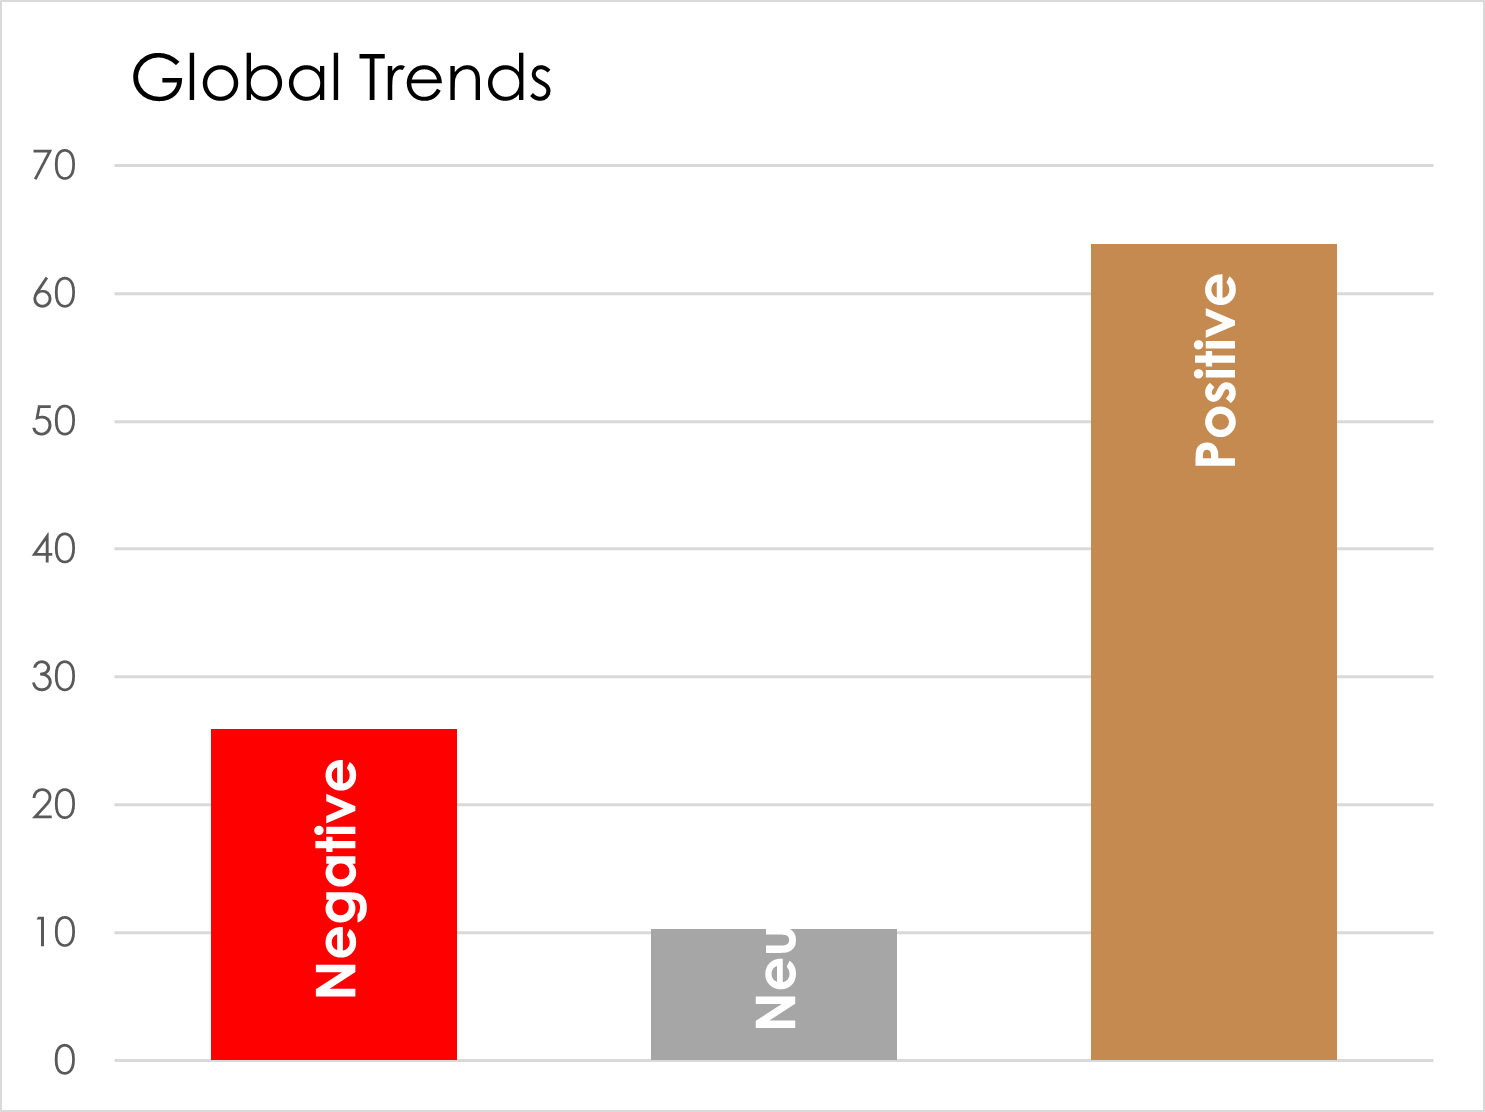
Global trends reveal 64% of countries show positive resource efficiency improvements, while 26% demonstrate negative trends and 10% remain neutral, highlighting the uneven pace of circular economy adoption.
Understanding Resource Intensity vs. Resource Efficiency
The Resource Index distinguishes between two complementary metrics:
- Resource Intensity: Measures materials, energy, and natural resources consumed per person. Lower intensity means less material consumption per capita.
- Resource Efficiency: Captures how effectively countries convert resources into economic value while minimizing waste. Includes circular economy practices, recycling rates, and waste reduction.
- Why Both Matter: A country can have low intensity simply by having limited industrial activity, while another achieves it through technology. The combined Resource Index distinguishes between underdevelopment and genuine innovation.
Less Developed Countries: Lower Consumption
Africa and the least developed countries dominate the top rankings, reflecting lower industrial activity rather than advanced resource management. Smaller manufacturing bases, large informal economies, and agricultural dominance mean lower per-capita consumption of energy, water, materials, and lower CO2 emissions compared to industrialized nations. Uganda, Angola, Zambia, and Cameroon rank high because their economic structures consume fewer processed materials, energy, and resources than manufacturing-intensive economies.
Developed Economies: De-industrialization vs. Efficiency
The UK's #5 position primarily reflects its near-complete de-industrialization—the loss of manufacturing capacity rather than efficiency gains. While this reduces resource intensity (energy, water, materials, waste, and CO2 emissions), it is not necessarily positive for competitiveness. The ideal would be maintaining industrial manufacturing with low energy, water, and material input. Switzerland, Sweden, and Denmark demonstrate that some developed economies can balance wealth creation with resource efficiency through innovation and strong environmental governance, though the challenge remains achieving efficiency while maintaining industrial capacity.
Industrial Powerhouses: High Resource Intensity
China's #143 ranking reflects its role as the world's manufacturing hub. Heavy industries—steel, cement, chemicals, and construction—require enormous material inputs. China's development model prioritizes infrastructure expansion and manufacturing exports, both highly resource-intensive.
The United States (#129) and Japan (#109) rank lower due to consumption-driven growth and manufacturing intensity. American resource intensity stems from suburban sprawl, large residential properties, and high consumption levels. Japan faces challenges from extensive manufacturing and limited domestic resources requiring high imports.
Germany (#32) performs better but still ranks relatively low as Europe's industrial powerhouse producing automobiles, machinery, and chemicals.
The Circular Economy Imperative
Improving resource efficiency requires transitioning from linear "take-make-dispose" models to circular economies where materials are reused and recycled. Current global circularity is only 8.6%—over 90% of materials are used once and become waste.
Why Resource Efficiency Matters for Competitiveness
- Cost Reduction: Materials and energy represent significant business costs; efficiency improves profitability
- Supply Chain Resilience: Resource-efficient economies are less vulnerable to commodity price volatility
- Regulatory Advantage: As environmental regulations strengthen globally, resource-efficient nations face lower compliance costs
- Market Access: Growing consumer preference for sustainable products favors resource-efficient producers
- Resource Security: Nations dependent on imported materials face geopolitical vulnerabilities
Resource efficiency is economic strategy
Countries that lead in resource efficiency will have competitive advantages in 21st-century economies. As material costs rise and environmental regulations tighten, resource-intensive economies face market access barriers and declining profitability.
Policy Pathways to Resource Efficiency
The most effective policy for improving resource efficiency is resource taxation—particularly on fossil energy and materials with adverse environmental impacts. This creates direct economic incentives to reduce consumption and shift to cleaner alternatives.
- Resource Taxation: Tax fossil fuels, virgin material extraction, and environmentally harmful materials while subsidizing recycled content and renewable alternatives
- Extended Producer Responsibility: Require manufacturers to manage products through end-of-life, incentivizing durable, recyclable design
- Public Procurement: Leverage government purchasing power to demand resource-efficient, circular products
- Right to Repair: Mandate product repairability and parts availability to extend product lifespans
- Industrial Symbiosis: Facilitate waste-to-resource exchanges where one industry's waste becomes another's input
- Standards and Labels: Establish durability standards and sustainability certifications to inform consumer choices
The Resource Efficiency Challenge
Despite growing awareness, global resource consumption trajectories remain unsustainable. Global material consumption has tripled since 1970 and continues rising. The world extracted 92 billion tons of materials in 2017; projections indicate this could reach 190 billion tons by 2060.
Several factors perpetuate resource-intensive development: GDP growth remains the primary policy objective and correlates with material throughput; consumption culture ties social status to material goods; products are designed for limited lifespans; and environmental costs are externalized from prices.
The Resource Usage Index 2025 demonstrates that resource efficiency and economic prosperity are not mutually exclusive. Nordic countries, the UK, and Switzerland show that advanced economies can achieve high living standards with lower resource intensity than peer nations. Their success provides blueprints for other countries—and illustrates that resource efficiency leadership creates competitive advantages in an increasingly resource-constrained world.
Explore Further
For detailed analysis, country-specific Resource Usage data, and comprehensive rankings, visit the Global Resource Efficiency Index or download the full GSCI 2025 Report.