Executive Summary
The total Global Energy market is worth somewhere between $6-8 Trillion, and undergoing rapid and accelerating transformation. Renewable electricity from wind & solar, including battery back-up, is now the cheapest form of energy available across virtually all road transportation, domestic heating and industrial applications. The question is: who is going to capture the future renewable technology market? The US vs China is a tale of two very different policy choices and trajectories. China has spent two decades building manufacturing dominance in renewable energy based on long-term industrial policies and planning, while the US has spent the same period doubling down on fossil fuels. The Global Sustainable Competitiveness Index (GSCI) data shows the result: China overtook the US in high-tech manufacturing in 2015, in overall competitiveness in 2022, and now leads by widening margins across every industrial indicator.
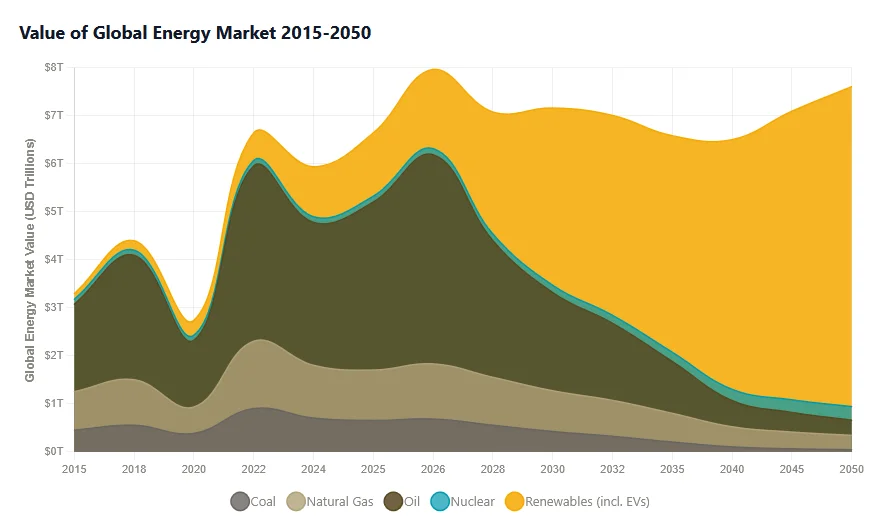
Understanding the US-China energy competitiveness gap begins with the global energy market itself. The chart below shows total energy market value across all sectors, providing context for the analysis that follows.
In this article
Manufacturing Capability Crossover
Until 2000, the US dominated high-tech manufacturing. The GSCI HighTech Manufacturing score told a clear story: US 59.8, China 41.7. American factories produced electronics, semiconductors, and advanced machinery. China was the follower.
By 2015, that ranking reversed. China crossed 59.8 while the US declined to 55 – the consequence of decades of investment in education and infrastructure, and industrial planning on the Chinese side while the US outsourced its knowledge in the name of shareholder value creation. The same year (2015), Chinese renewable energy exports began their exponential growth curve. The two events are connected by a single mechanism: manufacturing capability.
Today, in 2025, the gap has widened to 38 points: China 87.2, US 49.2. China's high-tech manufacturing ecosystem now covers solar panels, wind turbines, batteries, inverters, electric vehicles, heat pumps, electrolyzers, and associated electronics. The US has conceded most of these sectors. This is not a temporary advantage. This is a permanent shift in industrial capability.
The Global Sustainable Competitiveness Index measures what capabilities a nation possesses to produce goods the world wants. China possesses the capability to manufacture renewable energy equipment at scale, at low cost, with continuous improvement. The US does not. This gap translates directly into market share, export revenue, and geopolitical influence.
The manufacturing crossover in 2015 was the inflection point. It determined which nation would be able to capture renewable energy's explosive growth over the next decade. The US missed it, China seized it. The GSCI data shows the structural result: a 38-point manufacturing gap that will take the US sustained policy investment to narrow.
The Innovation Gap
Manufacturing dominance and innovation are locked together in a feedback loop. The GSCI tracks this through the Business Innovation indicator, where China scores 85.0 vs the US 64.8. That 20-point gap reflects not just R&D spending, but the speed at which innovations move from lab to market at scale.
The overall Economic Sustainability (a measure of competitive & sustainable productivity growth) crossed around 2012, when China broke 50 and has since pulled ahead to 59.7 vs US 56.1. The two metrics reinforce each other: China's massive manufacturing volume accelerates learning curves; faster learning curves drive cost reduction; lower costs increase market share; more market share funds more R&D. For example, every doubling of cumulative solar production generates a 20-28% cost reduction (Wright's Law in action). China has already doubled cumulative solar production multiple times. The US has not. This means:
- China's solar costs decline faster than US solar costs, even if both invest identically in R&D
- China's battery costs decline faster because it produces 65% of global batteries
- Lower costs mean more customers, more volume, more learning, faster cost decline, wider adoption
The GSCI Business Innovation score of 85.0 for China is not a temporary lead. It is the natural result of scale. To reduce this gap, the US would need to build that scale, which takes time. Every year without action widens the gap further.
Energy Income: US Collapse, China Gain
The manufacturing gap translates into revenue in real time. The three charts below separate the picture into its components: pure energy exports, the auto industry, and the combined total.
1 of 3: Energy Sector Only
Stripping out EVs and auto manufacturing, the energy-only comparison is already decisive. China's RE tech exports (solar, wind, batteries, inverters) overtake total US energy exports (oil + gas + RE combined) by 2028. By 2035, China RE tech alone reaches $650B while US total energy exports fall below $200B.
2 of 3: Auto Industry Only
The auto industry tells a different story. China's EV exports were negligible in 2015. By 2025 they reach $65B, surpassing US auto exports. By 2035, China ($210B) overtakes Japan/Korea ($158B) and closes the gap with Europe ($200B). However, unlike the energy sector, traditional auto powers are not collapsing. Hyundai and Kia already have full, competitive EV lineups. Japan has historically shown the ability to adapt rapidly when committed (Toyota invented the hybrid category). BMW, Mercedes, and Porsche hold strong premium EV positions. The main competitive pressure is price: Chinese brands undercut on cost, taking share in value segments while established OEMs retain mid-to-premium markets. The total global auto export market grows from $504B to $645B as China adds volume rather than simply displacing incumbents.
3 of 3: Combined (Energy + Auto)
When both sectors are combined, the full scale of the divergence becomes clear. China's total clean-tech exports (RE tech + EVs) reach $213B in 2025 and are projected to exceed $1.3 trillion by 2050. The shaded area between the two amber lines shows the EV contribution.
The numbers across all three views are unambiguous:
- China RE tech exports (excl. EVs) 2025: $148B; projected 2050: $1,016B
- China EV exports 2025: $65B; projected 2050: $300B
- China combined clean-tech exports 2025: $213B; projected 2050: $1,316B
- US total energy exports decline by more than 50% to less than $200B
- China's share of global auto exports grows from 8% (2024) to 47% (2050), driven by price competitiveness in volume segments
- Japan/Korea and EU auto exports decline moderately (15% and 25% respectively) as their OEMs successfully transition to EVs but lose share in price-sensitive markets
- US auto exports decline most steeply (62%) due to weakest EV export positioning
America's Fossil-First Gamble
The US energy economy is built on oil and gas, both in terminal decline as export revenue sources. Due to the cost and efficiency superiority of renewable energy, the US energy export economy faces a fundamental structural crisis:
- US oil exports 2024: $238B; projected 2035: $20B (down 92%)
- US natural gas exports: already flattening; LNG losing competitiveness to renewables
- US RE share declining from 11% of energy exports to 5% over the same period (BAU scenario)
Combined, total US energy export revenue collapses from $304B (2024) to $174B (2035), a 43% decline under a "business as usual" scenario, given current US policy.
The Inflation Reduction Act (IRA), while significant, is frozen at current funding levels. It has not generated a wave of battery gigafactories or domestic solar manufacturing. The companies still leading US energy exports are:
- Tesla in EVs (fast eroding to Chinese, European and Asian competition)
- First Solar in niche solar segments (not mainstream panels)
- GE Vernova in wind (losing to Vestas and Siemens Gamesa and Chinese manufacturers)
None of these are sufficient to reverse the trend. Meanwhile, China operates an integrated supply chain: 80% of solar panels, 65% of batteries, 60% of EVs, 70% of heat pumps, and rising percentages in electrolyzers, cables, inverters, and related equipment. China's manufacturing ecosystem is broad and deep. The US ecosystem is narrow and shrinking.
The GSCI HighTech score of 49.2 for the US reflects this reality. A score in the 40s indicates a nation that has lost manufacturing dominance and is dependent on imports.
China's Increasing Structural Advantage
China's GSCI HighTech score of 87.2 is not an accident or a temporary advantage. It is the result of systematic, sustained industrial policy over two decades. The architecture is:
Supply Chain Integration
China produces solar panels, batteries, inverters, motors, and integration software in the same industrial ecosystem. This vertical integration reduces costs, speeds innovation, and creates barriers to entry for competitors.
Wright's Law at Scale
Every doubling of cumulative production drives 20-28% cost reduction. China's head start in solar (2008-2015) and batteries (2015-2020) means it is already multiple doublings ahead. That advantage continues compounding.
Capital Abundance
State development banks, export credit agencies, and private capital flow constantly into renewable energy and battery manufacturing. There is no capital scarcity in China's renewable energy sector.
Continuous Expansion
While the US debates tariffs and subsidies, China is building new capacity in electrolyzers, heat pumps, e-buses, and batteries for aviation. The GSCI scope factor (1.29x for China) indicates it is entering product categories not yet fully modeled.
The GSCI HighTech trajectory is revealing: China rose from 41.7 (2000) to 87.2 (2025), a gain of 45.5 points in 25 years. The US declined from 59.8 to 49.2, a loss of 10.6 points.
The feedback loop is already running: Scale drives cost reduction, cost reduction drives market share, market share drives revenue, revenue funds more investment, more investment expands scale further. Each cycle is faster than the previous one because the cost curves have already shifted. China is operating on the steep portion of the Wright's Law curve where learning is fastest.
The Job Numbers
The competitiveness gap is not just about revenue and market share. It translates directly into employment. China's clean technology sector now employs over 13.7 million workers: roughly 8.2 million in RE tech (solar, wind, batteries, inverters) and 5.5 million in EV/auto manufacturing. For a fair comparison, the chart below includes US auto industry jobs alongside oil/gas and RE employment.
The result is striking. Even when the US side includes oil and gas (8.8 million under API broader methodology), renewable energy (745,000), and the entire auto industry (3.9 million), the combined US total of 13.4 million is already comparable to China's 13.7 million clean-tech workforce. By 2035, the gap widens to roughly 30 million vs. 9.7 million.
The question for the US is not whether to protect existing oil and gas jobs (which are declining regardless of policy). The question is whether to create new manufacturing jobs in clean technology before the window closes. Japan and Korea are transitioning their auto sectors successfully; Europe is investing heavily in EV manufacturing. China's 14.5 million clean-tech jobs did not appear overnight. They are the result of 20 years of industrial policy. The US has less than 5 years to begin building a comparable workforce pipeline.
The jobs data demolishes the false choice between "energy jobs" and "climate action." China proves that clean technology manufacturing creates far more employment than fossil fuel extraction. Japan and Korea show that auto industries can successfully pivot to EVs. The US is the outlier: declining oil jobs, weak EV export positioning, and no industrial policy to build clean-tech manufacturing at scale. The GSCI manufacturing gap explains why those new jobs are being created in China and increasingly in Asia, not the US.
US: Window for Change Closing Fast
The chart below shows the critical policy decision point: business as usual vs. a decisive policy pivot.
Under business as usual (BAU), total US energy export revenue declines from $304B (2024) to $174B (2035), a 43% loss. The US becomes a minor player in global energy exports, reliant on oil income that continues collapsing.
Under a policy pivot scenario, the US could maintain or grow its energy export share by investing in:
- Battery gigafactories (domestically, in partnership with allies)
- Large-scale solar manufacturing to capture mainstream panel market
- Grid modernization and energy storage infrastructure
- Supply chain for critical minerals and processing
As a result, US energy exports could reach $400-500B annually by 2040, sustaining 15-18% of global market share. This is not a return to dominance. It is stabilizing at a competitive position.
However, the window is narrow: 3 to max 5 years remain to change course. Manufacturing facilities take 2-3 years to build and ramp. Supply chains take longer to establish. By 2029-2030, if no major capacity comes online, the US will have lost the decade and the gap becomes structural (as it is already becoming for China).
China spent $50B+ annually on renewable energy industrial policy for a decade. For the US to match that intensity would require $40-60B/year in sustained battery, solar, and supply chain investment. That sounds large until compared to the alternative: a $130B loss in annual energy export revenue (the difference between $304B and $174B). A $50B pivot is cheaper than inaction by $80B/year.
Sustainable Competitiveness and Economic Success
The US-China energy competitiveness gap and the coming income gains against US losses are not about ideology, politics, or trade wars. The sustainable competitiveness gaps are structural, not cyclical. Sustainable Competitiveness as measured by the 280 indicators of the Global Sustainable Competitiveness Index (GSCI) means investing in the underlying capabilities: human capital, infrastructure, supply chains, capital formation. China has done this while the US was concentrating on shareholder value.
The mechanism is simple: Manufacturing dominance creates cost leadership; cost leadership creates market capture; market capture creates revenue; revenue funds investment; investment expands scale; scale reinforces manufacturing dominance. This loop is already running in China's favour while the US has left the loop – mostly voluntarily – long ago. The question is whether the US will intervene to stop its own decline before it becomes irreversible for decades to come.
Explore the GSCI Data
The competitiveness metrics in this article are drawn from the Global Sustainable Competitiveness Index. Explore the underlying rankings:
Related analysis:
Gulf States & the Energy Transition →Read the Companion Analysis
For a deeper dive into global renewable energy markets, supply chain dynamics, and long-term export projections, see our companion article: "The Global Energy Market Outlook"
That analysis provides the market-level context for understanding why these GSCI competitiveness gaps matter in real economic terms.
Methodology
All projections in this article are derived from SolAbility's S-curve energy transition model, calibrated against verified 2024 data. The diagram below summarizes how the three model layers interact to produce the forecasts used throughout this analysis.
Frequently Asked Questions
How is the GSCI calculated?
The Global Sustainable Competitiveness Index assesses 185 quantitative indicators across 195 countries. It measures natural capital, resource efficiency, intellectual capital, social cohesion, and governance. The HighTech Manufacturing sub-index reflects factory capacity, supply chain depth, patent output, and export sophistication. It is not opinion-based: all inputs are measured data from international statistical agencies.
Can the US close the 38-point HighTech gap?
Not quickly. China built its lead over 25 years of sustained industrial policy. The US would need to invest $40-60B annually in battery gigafactories, solar manufacturing, and supply chain infrastructure for at least a decade to stabilize the gap. Full closure would take longer. The realistic goal is not to match China, but to arrest the decline from 59.8 to 49.2 and rebuild to a competitive position (around 60-65).
Why does the US rank #184 in Energy Sustainability?
The GSCI Energy Sustainability score reflects whether a nation's energy sector is growing or contracting, diversifying or concentrating. The US scores low because its energy exports are dominated by oil and gas, both facing structural demand decline. Nations that have diversified into renewables score higher. China ranks #67 because its energy export mix is shifting toward manufactured renewable energy products.
What is the policy pivot scenario?
The policy pivot assumes the US maintains IRA funding, adds $40-60B/year in battery and solar manufacturing investment, and builds domestic supply chains for critical minerals. Under this scenario, US RE market share stabilizes at 15-18% (vs 5% under BAU) and total energy exports reach $400-500B annually by 2040. This is not dominance; it is competitive viability.
How does Wright's Law apply here?
Wright's Law states that every doubling of cumulative production drives a 20-28% cost reduction. China has already doubled cumulative solar production multiple times and leads in battery production (65% global share). This means China's costs decline faster than competitors even with identical R&D spending. The cost advantage compounds with each production cycle, making late entry progressively harder.