Executive Summary
The global energy market is worth $6-8 trillion annually, and has been dominated by fossil fuels (oil, gas, coal) for more than a century. However, thanks to innovation and mass production, renewable energy technologies are now cheaper across virtually every application, leading to a fundamental structural transformation of the energy market. This rapid and accelerating shift is not driven by environmental regulation or political preference - it is purely driven by cost. Renewables have become the lowest-cost energy source on Earth.
- Solar and wind now generate electricity at $0.03-0.06 per kilowatt-hour, 50-70% cheaper than new fossil fuel plants. Combined with battery storage at $70 per kilowatt-hour (down 90% in a decade), renewables are the lowest-cost energy source in most markets globally.
- Electric vehicles have reached cost parity with internal combustion engine cars in most segments, with significantly lower operating and maintenance costs. EV sales are now 20% plus of global new car sales and accelerating. By 2030, EVs will be cheaper than combustion vehicles across all segments.
- Heat pumps deliver 3-4 times the heating per unit of energy compared to gas boilers, making them substantially cheaper to operate. In new construction, heat pumps are now the default in most European and Asian markets. Retrofit heat pump costs are declining and approaching replacement cost parity with gas boilers.
- Industrial electric heating, including arc furnaces, induction heating, and electric kilns, is replacing fossil-fired processes in steel, glass, ceramics, and chemicals at lower cost, driven by cheap renewable electricity. Hydrogen production via electrolysis is now competitive with steam methane reforming at electricity prices below $50 per megawatt-hour.
The result: Renewables grow from 3.5% of the total energy market in 2015 to over 50% by 2030 and 88% by 2050. Oil shrinks from 55% to close to zero%. The total market stays in the $6-8 trillion range, but the value shifts from fuel commodities to manufactured equipment.
The question is no longer whether this transition happens. The question is: who captures the trillion dollar renewable energy manufacturing market?
Given China's current technological and production cost advantage, it is safe to assume that the whole of the Chinese market will be captured by domestic providers, which leaves the rest of the world's energy market (estimated $3-5 trillion) up for grabs:
- China (30% market share today),
- Europe (26%),
- Japan/Korea (12%),
- United States (11%),
- Emerging markets (20%).
This article examines each player's trajectory, the collapse of oil revenues, the impact on Gulf states, and the competitiveness data that confirms this shift.
In this article
Country competitiveness in renewable energy
The global renewable energy market is heading toward $3-5 trillion annually by mid-century. This is not a forecast based on optimistic assumptions, it is based on observable manufacturing trajectories, logistic adoption curves, and cost-reduction dynamics already in motion. The question is no longer whether this market materializes. The question is: who captures it?
Five players are currently dominating the competition: China leads with 30% of the rest-of-world (ROW) market in 2025, built on manufacturing dominance in solar, batteries, and EVs. Europe holds 26%, mainly from wind turbines (Vestas, Siemens Gamesa) and grid infrastructure (ABB, Schneider). Japan and Korea command 12%, driven by batteries (LG, Samsung SDI, Panasonic) and EVs (Hyundai, Kia). The US share is 11%, led by Tesla, First Solar, and GE Vernova. Emerging markets, including India, Southeast Asia, and the Middle East, account for the remaining 20% and are growing fast. The competitive gaps behind these positions are quantified in the Global Sustainable Competitiveness Index (GSCI), which measures 280 indicators across 193 countries: China scores 88 in high-tech manufacturing versus the US at 49.2, reflecting the industrial gap that drives market share outcomes.
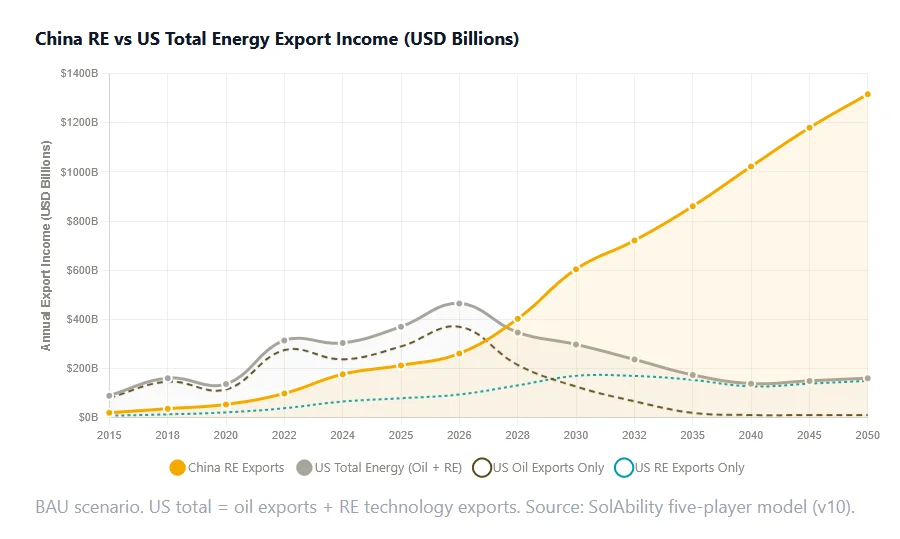
The magnitude of the market transformation is not only economic, but might also reshape global power balances: In 2024, US oil exports generated $238 billion while Saudi Arabia's oil revenues reached $230 billion. By 2035, under baseline assumptions, China's RE market capture alone reaches $861 billion, while US oil exports collapse to $20 billion and Saudi revenues fall to $64 billion. The chart below shows the key players' market capture stacked against declining oil revenues.
The model calculations tell a clear story: the global renewable energy market (excluding China) grows from $584 billion in 2024 to $1.9 trillion by 2030 and $3.1 trillion by 2050. China's share grows disproportionately, from 30% to 42% of the total. The dashed lines show oil revenues collapsing through the same period. By 2030, China's RE market capture alone ($605 billion) exceeds US oil exports ($127 billion) and Saudi revenues ($144 billion) combined. By 2035, the comparison is not even close.
Why does China capture this market while the US does not? The Global Sustainable Competitiveness Index (GSCI), which tracks 280 quantitative indicators across 193 countries, shows that China overtook the US in high-tech manufacturing capability in 2015 and now leads by 38 points. These crossover points map directly onto the revenue divergence shown above.
China's HighTech Manufacturing score rose from 41.7 (2000) to 87.2 (2025), a 45-point gain reflecting two decades of sustained industrial policy. The US declined from 59.8 to 49.2 over the same period. This 38-point gap is the structural foundation of China's market dominance: it measures the factories, supply chains, workforce skills, and innovation capacity that produce solar panels, batteries, and EVs at scale and at lower cost than any competitor.
Market Share Trajectories
China
China's share of the global RE market rises steadily from 30% to 42%, through manufacturing scale and cost leadership across solar (80%+ of global capacity), batteries (65%+), and EVs (60%+ of global exports). This share growth compounds: at 42% of a $3.1 trillion market, China captures $1.3 trillion annually by 2050.
Europe
Europe's trajectory is the mirror image. From 26% in 2024, European share declines to 20% by 2035 and 15% by 2050. However, Europe is not expected to shrink in absolute terms: RE revenues grow from $154 billion to $470 billion. Europe loses relative position as China outscales it in manufacturing and emerging markets build local capacity. Europe retains strongholds in wind (Vestas holds 34% of ex-China market) and grid equipment (ABB, Schneider, Siemens), but its weakness in solar manufacturing (less than 2% global) and batteries (Northvolt's bankruptcy, ACC's struggles) limits overall market share.
USA
The US story is the most dramatic. Under current policies, US market share declines from 11% to 7% by 2035 and 5% by 2040. In absolute terms, US RE revenues peak around $171 billion in 2030 then decline to $128 billion by 2040, reflecting a deliberate policy choice: while the rest of the world scales renewable manufacturing, the US doubles down on oil, gas, and legacy energy infrastructure. While US oil exports will collapse from $238 billion to $20 billion by 2035, the country simultaneously loses ground in the industry that is replacing oil. Our analysis finds that the window to successfully change course is closing rapidly. The structural and know-how deficits against competitors will have reached a gap that will be baked in and virtually impossible to overcome if a dramatic policy shift is not implemented before 2030.
Japan/Korea follows a trajectory similar to Europe's but from a smaller base. Their 12% share in 2024 declines to 10% by 2035 and 7% by 2050. Battery manufacturing (LG, Samsung SDI, Panasonic combined 19% global share) provides a strong foundation, and Hyundai/Kia maintains competitive positions in EVs, but Chinese competition erodes margins across all segments.
Emerging markets are perhaps the most consequential. Starting at 20%, emerging market share grows to 24% by 2035 and 30% by 2050. India (Tata, Adani), Southeast Asian assembly operations, and Middle Eastern solar deployments represent localized manufacturing capacity that grows as the market matures. This growth comes partly at the expense of incumbent players, particularly Europe and Japan/Korea, as developing countries build domestic RE industries.
Country Assessment
China: The Manufacturing Hegemon
China's position rests on integrated supply chain dominance. It controls 80% plus of global solar module manufacturing, 65% plus of lithium-ion battery cell production, and 60% plus of EV exports. Market share rises from 30% ($177 billion) in 2024 to 42% ($1,316 billion) by 2050. The absolute numbers are staggering: China's RE market capture in 2050 exceeds the current GDP of all but the top five economies. China's competitive advantage spans manufacturing scale (Wright's Law cost reductions), integrated supply chains (from mining to assembly), government industrial policy, and first-mover advantage in emerging segments like electrolyzers and industrial heating equipment. The GSCI HighTech score of 87.2 quantifies what is visible on the ground: a nation that has built the world's deepest manufacturing ecosystem for renewable energy equipment.
United States: The Fossil-First Gamble
Under current policies, the US RE share declines from 11% ($66 billion) to 5% ($128 billion) by 2040. Tesla's EV share erodes as BYD and Chinese competitors scale globally. First Solar retains solar niche leadership, and GE Vernova holds wind positions, but these cannot offset the broader retreat from renewable energy policy. The GSCI Energy Sustainability rank of #184 out of 195 countries reflects a structural dependence on fossil fuel exports that is now a liability. The result: US oil exports disappear by 2035 ($20 billion), and the country fails to replace them with RE manufacturing. A different policy posture, maintaining IRA incentives, investing in battery manufacturing, scaling domestic solar, could sustain 15-18% market share, capturing $400-500 billion annually by 2040. The window for this pivot is narrowing rapidly. Manufacturing capacity takes 3-5 years to build. A policy change in 2027 produces results by 2031-2032. A change in 2030 may be too late.
Europe: Strong Wind, Weak Batteries
Europe maintains structural advantages in wind energy (Vestas holds 34% of ex-China market, Siemens Gamesa remains major), grid infrastructure (ABB, Schneider, Siemens), and heat pumps (Bosch, Viessmann, Daikin EU operations). GSCI data shows European leaders (Germany, Sweden, Denmark, Netherlands) scoring 62-68 in HighTech Manufacturing, well above the US but far below China. But Europe's critical weakness is manufacturing: less than 2% of global solar panel production and a collapsing battery industry (Northvolt bankrupt, ACC struggling). Market share falls from 26% ($154 billion) to 15% ($470 billion) by 2050. Europe grows in absolute terms but loses the manufacturing race to China and emerging competitors. Europe's path forward requires aggressive battery manufacturing investment and solar assembly scale-up, but both require capital and policy commitment that have been inconsistent.
Japan/Korea: The Battery Stronghold
Japan and Korea's competitive position centers on batteries: LG Energy Solution (9% global), Samsung SDI (5%), and Panasonic (5%) collectively hold 19% of the global battery market. GSCI HighTech scores of 71.4 (Japan) and 74.8 (Korea) confirm strong manufacturing capability, second only to China among major economies. Hyundai/Kia maintains approximately 9% global EV share, and Toyota's slow pivot to battery electric vehicles could preserve Japanese automotive relevance. However, Chinese battery manufacturers (CATL 37%, BYD 16%) are outscaling Korean competitors on cost. Market share declines from 12% ($68 billion) to 7% ($219 billion) by 2050, doubling in absolute terms but losing relative position. Japan/Korea's survival depends on maintaining battery cost competitiveness against Chinese scale.
Emerging Markets: The Rising Tide
India (Tata, Adani solar), Southeast Asia (assembly and local manufacturing), and Middle Eastern solar deployments represent the fastest-growing segment. Starting from 20% ($119 billion), emerging market share grows to 30% ($942 billion) by 2050. GSCI data shows India (HighTech 48.3) approaching the US level (49.2), with Vietnam and Indonesia among the fastest-rising nations in manufacturing capability. This growth reflects domestic industrialization, trade policy favoring local content, and technology transfer from Chinese investments. India alone could become the third-largest RE manufacturer by 2040, particularly in solar modules and EV assembly. However, emerging markets face challenges: limited access to capital, lower engineering capacity, and competitive pressure from incumbent players. The growth trajectory assumes sustained investment in local manufacturing capacity and technology development.
Oil Price Dynamics
The US/Israel war against Iran pushed Brent crude to a temporary high of above $120 per barrel, the highest sustained level since the Russian invasion of Ukraine. However, this peak (the length of which depends on when a meaningful agreement beyond the current phantom ceasefire as of May 2026 can be reached) might well turn out to be oil's last hurrah. As EV adoption follows its disruptive S-curve trajectory (20% of new sales in 2024, 36% by 2026, 90% by 2030), demand destruction accelerates. Each new EV removes not just today's fuel consumption but eliminates demand over the vehicle's entire 12-15-year life.
However, the average age of vehicles on the road means oil demand declines more slowly than sales figures suggest. But by 2028-2030, cumulative fleet replacement reaches critical mass. Oil prices are set to decline from $78 per barrel in 2028 to $59 by 2030, $50 by 2032, and $38 by 2035, eventually settling at the $25 per barrel floor, the marginal cost of Saudi/Gulf oil production.
This price trajectory is the narrative hook that connects everything. As oil prices collapse, the trillions in annual revenue currently flowing to oil producers must be replaced. The global RE market is exactly that replacement, and the players who capture it will define economic power for the next half-century. Saudi Arabia's oil revenues fall from $260 billion in 2026 to $64 billion by 2035. US oil exports collapse from $300 billion (2026 Iran war spike) to $20 billion. Where does that economic value go? It flows to whoever manufactures the solar panels, batteries, EVs, wind turbines, and grid equipment that the world is buying instead.
The Shale Oil Margin Squeeze Hitting The US/Canada
Saudi Arabia survives the oil price collapse because its production costs are the lowest on Earth, roughly $8 per barrel for extraction from super-giant fields that have been producing for seventy years. Even at $25 per barrel, Saudi Arabia operates profitably on pure extraction economics. The fiscal breakeven of $80-85 per barrel reflects government spending commitments, not production physics. Saudi will need to cut spending, but it won't stop pumping oil.
US shale tells the opposite story. Every well depletes at 50% plus annual rates. Maintaining flat production requires continuous drilling at breakeven costs averaging $45-50 per barrel. Below that price, no new wells achieve positive net present value. Without new wells, production collapses. The margin chart shows Saudi margins holding steady at 68% plus even as prices fall, while US shale margins hit zero by 2030 and never recover.
This creates a double blow for the US economy under current policies. Not only do US oil exports collapse as prices fall below shale breakeven, but the US is simultaneously losing market share in the industry replacing oil. In 2024, US oil exports ($238 billion) dwarf US RE market capture ($66 billion) by 3.6 times. By 2035, US oil exports have collapsed to $20 billion and US RE capture has peaked and begun declining at $154 billion. The net effect: the US goes from $304 billion combined energy industry to $174 billion, a 43% decline in a decade.
Gulf States: The Revenue Cliff
The Gulf Cooperation Council states (Saudi Arabia, UAE, Kuwait, Qatar, Bahrain, Oman) collectively earned $921 billion in oil revenues at the 2026 peak. By 2040-2050, this falls to $186 billion, a 75% collapse. This is not a gradual decline that allows orderly transition. It is a structural cliff that hits within a decade and creates fiscal crises for every oil-dependent state in the region.
Saudi Arabia, the world's largest producer at 9 million barrels per day, has the lowest production cost at $4 per barrel. But it also has the highest government spending and the largest welfare state. Saudi Arabia's fiscal breakeven sits at $96 per barrel. As prices fall toward $25-38 per barrel by 2035, Saudi Arabia must choose between maintaining government services or continuing oil production at breakeven extraction costs. Vision 2030 is not an ambitious diversification plan; it is a survival strategy. Without successful economic diversification, Saudi Arabia faces either decades of austerity or fiscal insolvency.
Iraq is the second-largest Gulf producer at 4.4 million barrels per day but has the highest fiscal dependency on oil. Iraq's fiscal breakeven is $94 per barrel, reflecting high government spending and low state capacity. Below $50 per barrel, Iraq cannot fund government operations without external support. Iraq is the most vulnerable large Gulf state to collapse.
UAE stands out for economic diversification. Dubai's non-oil economy is larger than its oil revenues. The UAE's fiscal breakeven is the lowest among large Gulf producers at $55 per barrel. The UAE is the best positioned to survive the revenue cliff, though its federal budget will still contract sharply.
Kuwait and Iran occupy middle positions in vulnerability. Kuwait has massive sovereign wealth reserves (approximately $700 billion) that provide a multi-decade cushion even at $25 per barrel prices. Iran's fiscal breakeven is approximately $85 per barrel, making it vulnerable, but international sanctions already isolate Iran from capital markets, limiting the shock of revenue decline.
Qatar presents a unique case. Gas is Qatar's dominant revenue source; LNG revenues of $132 billion exceed oil revenues by 4 times. Qatar's fiscal breakeven on oil is $43 per barrel, the lowest in the Gulf. Qatar is well-positioned for the transition. However, Qatar's economy is entirely reliant on hydrocarbons. Diversification beyond oil and gas remains limited.
Oman and Bahrain are small producers with limited reserves and high fiscal dependency. Both face economic stress that may require external support or fundamental restructuring.
The chart above shows the arc: Gulf states enjoy a windfall peak in 2025-2027 at $921 billion combined. By 2035, revenues have fallen 60% to $360 billion. By 2050, they reach the sustainable floor of $186 billion, a 75% collapse from peak. The years 2025-2027 represent the last window for these states to diversify economically. Every dollar of oil revenue not reinvested in non-oil sectors, education, technology, or manufacturing during these three years represents a permanently lost opportunity. After 2027, falling revenues will be consumed by defending existing government spending, leaving no surplus for transformation.
Implications
A coherent energy market analysis shows a structural shift in global economic power. By 2035, the renewable energy market outside China reaches $2.2 trillion annually, larger than the current GDP of Italy or Brazil. The players who manufacture, export, and install this equipment capture the economic value that until now flowed through oil pipelines and tanker routes. The GSCI data confirms which nations have the industrial capability to capture this value: China (HighTech 87.2), Japan/Korea (71-75), European leaders (62-68), and the US (49.2). These scores are not opinions; they are measured manufacturing capability that translates directly into market share.
For the United States, this analysis presents an urgent strategic choice. Current policy locks the country into a declining 5% share of the world's fastest-growing industrial market while the US oil industry simultaneously collapses. The GSCI trajectory makes the urgency concrete: China built its HighTech score from 41.7 to 87.2 over 25 years. The US declined from 59.8 to 49.2. Reversing this decline requires sustained investment on a similar timescale, but stabilizing at a competitive position (60-65) is achievable in a decade with the right policy. An alternative posture, maintaining IRA incentives, investing in battery gigafactories, scaling domestic solar manufacturing, could preserve 15-18% market share and capture $400-500 billion annually by 2040. However, the window for this pivot is narrowing rapidly. Manufacturing capacity takes 3-5 years to build, and supply chains take even longer. First-mover advantages accumulate over time. A decision in 2027 produces results by 2031-2032. A strategic shift in 2030 may be too late to recover lost ground.
For oil-dependent economies, the message is existential. Saudi Arabia's Vision 2030 diversification is not ambitious; it is necessary for survival. Countries dependent on oil revenues (Nigeria, Angola, Venezuela, Iraq) face fiscal collapse when prices normalize at $25-38 per barrel. The windfall years of 2025-2027 are the last window to diversify. Every dollar of oil revenue not reinvested in economic diversification during the next three years represents a permanently lost opportunity. For these states, the choice is not growth or austerity. The choice is transition or collapse.
For investors, the positioning is clear. China-exposed RE manufacturing offers the highest growth trajectory, but concentration risk is real. A diversified approach includes exposure to Chinese solar and battery manufacturers; European wind companies (Vestas, Siemens Energy, Schneider Electric) which provide stability in segments where European firms retain structural advantages; Korean battery manufacturers offering growth at lower valuations than Chinese peers; and emerging market RE plays (Indian solar manufacturers, Southeast Asian EV assembly) which represent the highest-risk, highest-upside bets. A portfolio approach balances growth, diversification, and concentration risk.
Methodology
All projections in this article are derived from SolAbility's S-curve energy transition model, calibrated against verified 2024 data. The diagram below summarizes how the three model layers interact to produce the forecasts used throughout this analysis.
Frequently Asked Questions
Can the US catch up if it changes policy direction?▼
Yes, but the window is narrowing. Our model shows a "policy pivot" scenario where maintaining IRA incentives and investing in battery and solar manufacturing could sustain 15-18% US market share, capturing $400-500 billion annually by 2040 instead of $128 billion. However, manufacturing capacity takes 3-5 years to build. A pivot in 2027 would produce results by 2031-2032. A pivot in 2030 may be too late to recover lost ground against Chinese and emerging market competitors who will have cemented supply chain advantages.
Why does China's share keep rising even as others grow?▼
China's share growth reflects compounding manufacturing advantages. Wright's Law dictates that for every doubling of cumulative production, costs fall 20-28%. China's massive head start in solar, battery, and EV manufacturing means its cost curves decline faster than competitors, creating a self-reinforcing cycle. Additionally, China captures new market segments (e-buses, electrolyzers, heat pumps) earlier than competitors, adding breadth to its export base. As long as China maintains scale leadership, its market share will continue rising even as absolute market sizes grow for all competitors.
Could tariffs and trade barriers limit China's market capture?▼
Tariffs can slow but not reverse the trend. The EU's anti-dumping duties on Chinese solar (2013-2018) failed to create competitive European manufacturing; they simply raised costs for European consumers and slowed deployment. US tariffs on Chinese EVs and solar face the same dynamic: they protect domestic industry short-term but increase transition costs. More importantly, China's manufacturing advantage is so large (40-60% cost difference in solar, 30-40% in batteries) that tariffs would need to be prohibitively high to equalize prices. At such levels, they slow the overall transition and increase costs for the tariff-imposing country.
What about India as a challenger to China?▼
India is the most likely country to challenge China's dominance in specific segments, particularly solar module assembly (Tata, Adani) and EV manufacturing for the domestic market. Our model includes India within the "Emerging Markets" category, which grows from 20% to 30% share by 2050. India could potentially capture 10-12% alone by 2040-2050. However, India starts from a much smaller manufacturing base, lacks China's integrated supply chain, and faces infrastructure and capital constraints. India will be a significant player, but displacing China's overall leadership would require a decade of sustained industrial policy and investment.
Won't oil prices recover as EVs saturate?▼
Oil demand stabilizes at 20-30 million barrels per day by 2050 (half today's level) as aviation, shipping, and chemicals retain fossil fuel requirements. This residual demand supports Saudi production at $25-40 per barrel but will not restore premium prices. The question is not whether oil remains useful (it does), but whether it commands premium prices. Almost certainly not. At $25 per barrel, only the lowest-cost Middle Eastern producers survive profitably. This sets the price ceiling for the next half-century.
What are the implications for Gulf states if oil revenues collapse?▼
Gulf states collectively earned $921 billion in oil revenues at the 2026 peak and will earn $186 billion by 2050, a 75% collapse. This is not a gradual decline; it is a cliff that hits within a decade. Saudi Arabia has the largest fiscal needs but the lowest production costs; it can survive but requires spending cuts. Iraq is the most vulnerable, with the highest fiscal dependency on oil. UAE is the best positioned, with a diversified economy. The critical point: the years 2025-2027 represent the last window for these states to diversify. After that window closes, falling revenues will be consumed by defending existing government spending, leaving no surplus for transformation.
Conclusion: The Race Is Already Underway
The $3-5 trillion renewable energy market is materializing whether governments encourage it or not. Manufacturing economics, learning curves, and physics-based deployment timelines have passed the point of no return. Solar at $0.06 per kilowatt-hour, batteries at $70 per kilowatt-hour, and EVs at cost parity with combustion vehicles have locked in adoption trajectories that no political movement can reverse.
The only question that remains is who captures the value. Under current trajectories, China consolidates manufacturing hegemony with 42% market share. Europe retains niche strengths but declines overall. Japan and Korea hold battery positions but lose ground. Emerging markets rise through localized manufacturing. And the United States, choosing fossil fuels over renewable manufacturing, watches its combined energy industry shrink by 43% in a decade.
This is not a distant scenario. The data points anchoring this model are from 2024-2025. The manufacturing capacity is installed or under construction. The S-curves are observable. The oil price trajectory follows basic supply-demand physics. The revenue collapse for Gulf states is locked in by depletion curves. The race is already underway. The winners and losers are becoming clear. The remaining question is whether lagging players change course before the window closes.
For investors, the trajectory is clear: capital flows to wherever manufacturing scale combines with cost leadership. For policymakers, the choice is stark: invest in the industries replacing fossil fuels, or manage the decline of incumbent energy sectors. For oil-dependent economies, the time to act is now. The next three years (2025-2027) represent the last opportunity to use windfall revenues for economic transformation. After that window closes, the cliff arrives, and transformation becomes survival.
Explore the GSCI Data
The competitive positioning data in this article is drawn from the Global Sustainable Competitiveness Index. Explore the underlying rankings:
Related analysis:
Gulf States & the Energy Transition →Read the Companion Analysis
For a policy-focused analysis of the US-China energy competitiveness gap, using Global Sustainable Competitiveness Index (GSCI) data to quantify the industrial divergence, see our companion article: "Drill Baby Drill vs Electrification: The US-China Energy Competitiveness Gap"
That analysis uses 185 quantitative GSCI indicators to explain why China leads in renewable energy manufacturing and what the US would need to do to compete.